Litecoin, IOTA, Aave Price Analysis: 14 May

Litecoin trimmed its losses between $300-$330, but the spotlight would likely remain within this zone. IOTA bulls were required to defend the $1.63-support to avoid a breakdown from a descending triangle. Finally, a green candle would likely see the market’s bulls retain control of AAVE over the short term.
Litecoin [LTC]
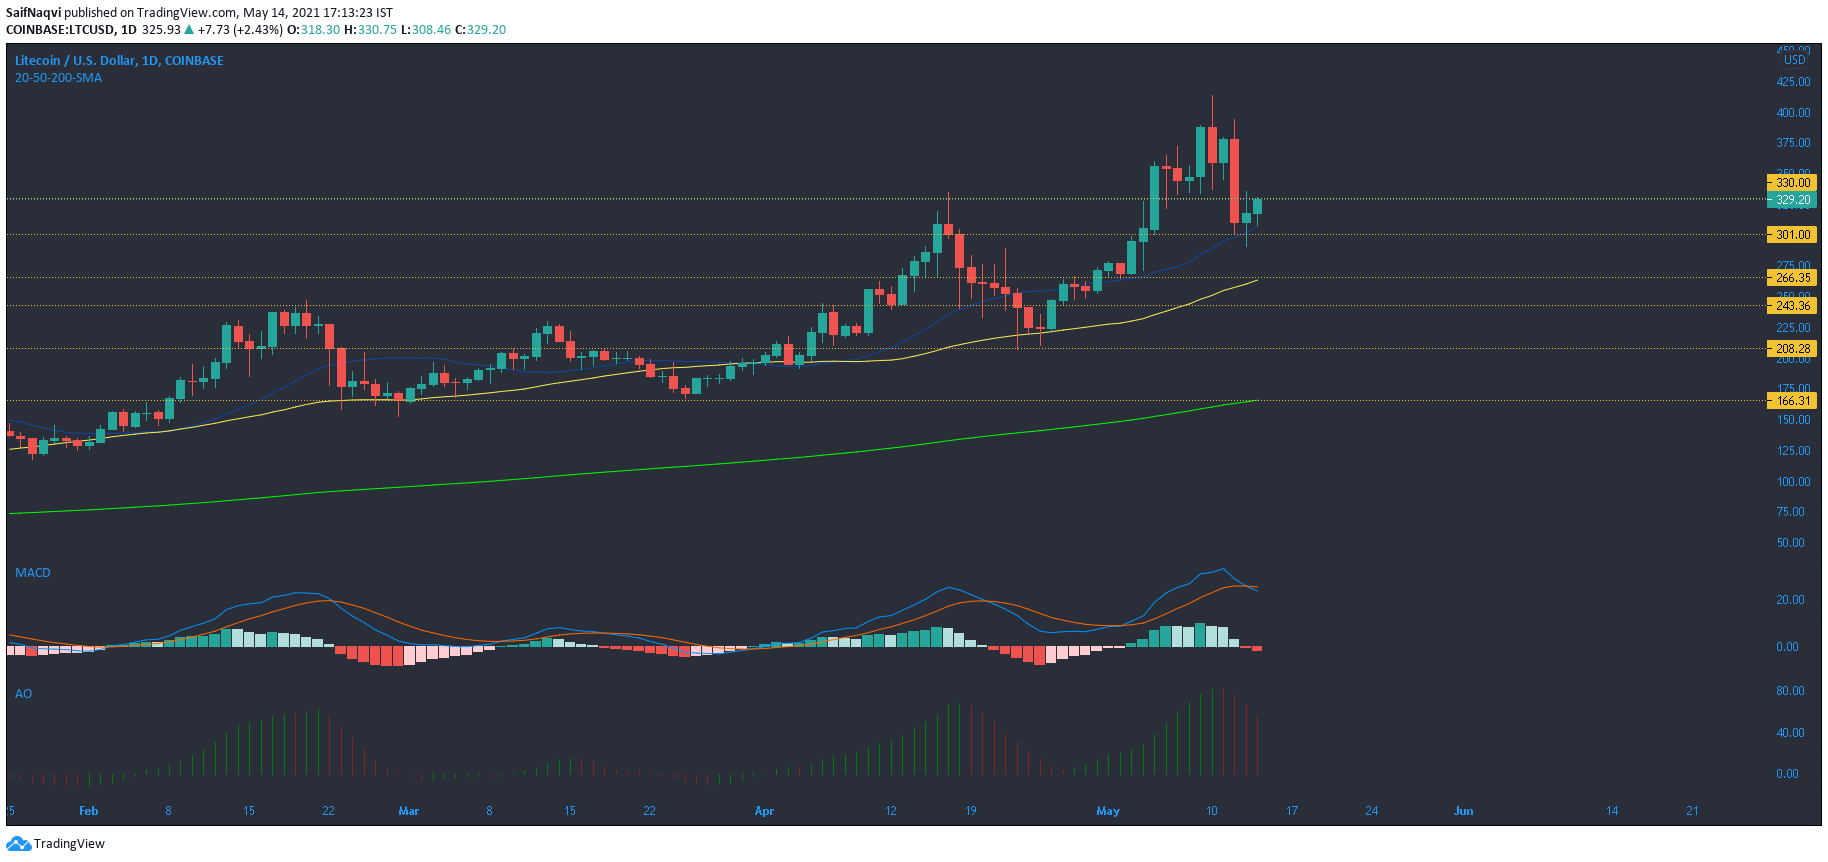
Large cap alts, including Litecoin, were provided with fresh impetus after Ethereum reclaimed the $4,000-mark. Litecoin shifted back into the green zone and rose by over 2% over the last 24 hours. The region between $300-$330 defended an extended sell-off, but the next few days would provide more clarity to this area’s resilience. In case of a broader market fall, it seemed likely that this area would be breached by the market’s bears. This would underline the next defensive zone between $266.3 and $243.3. This zone also clashed with the 50-SMA (yellow).
A bearish crossover in the MACD still pointed to weakness in the market’s price. The Awesome Oscillator’s red bars agreed with the MACD as bulls were yet to take control.
IOTA

IOTA’s bottom trendline at $1.63 represented a crucial support area. A breakdown from this defensive front could result in a sharper sell-off towards $1.28 or even the 200-SMA (now shown) close to $1.01. On the other hand, the upper trendline needed to be pierced for a bullish outcome.
Since late February, the On Balance Volume has generally maintained an uptrend – a sign of healthy buying pressure in the market. If investors decide to take profits after a sustained period of buying, IOTA would likely drop below its long-term simple moving average. Conversely, the buying pressure could aid IOTA in the event of a bearish downturn.
According to the Chaikin Money Flow, capital inflows have been on the up over the past few days.
Aave [AAVE]
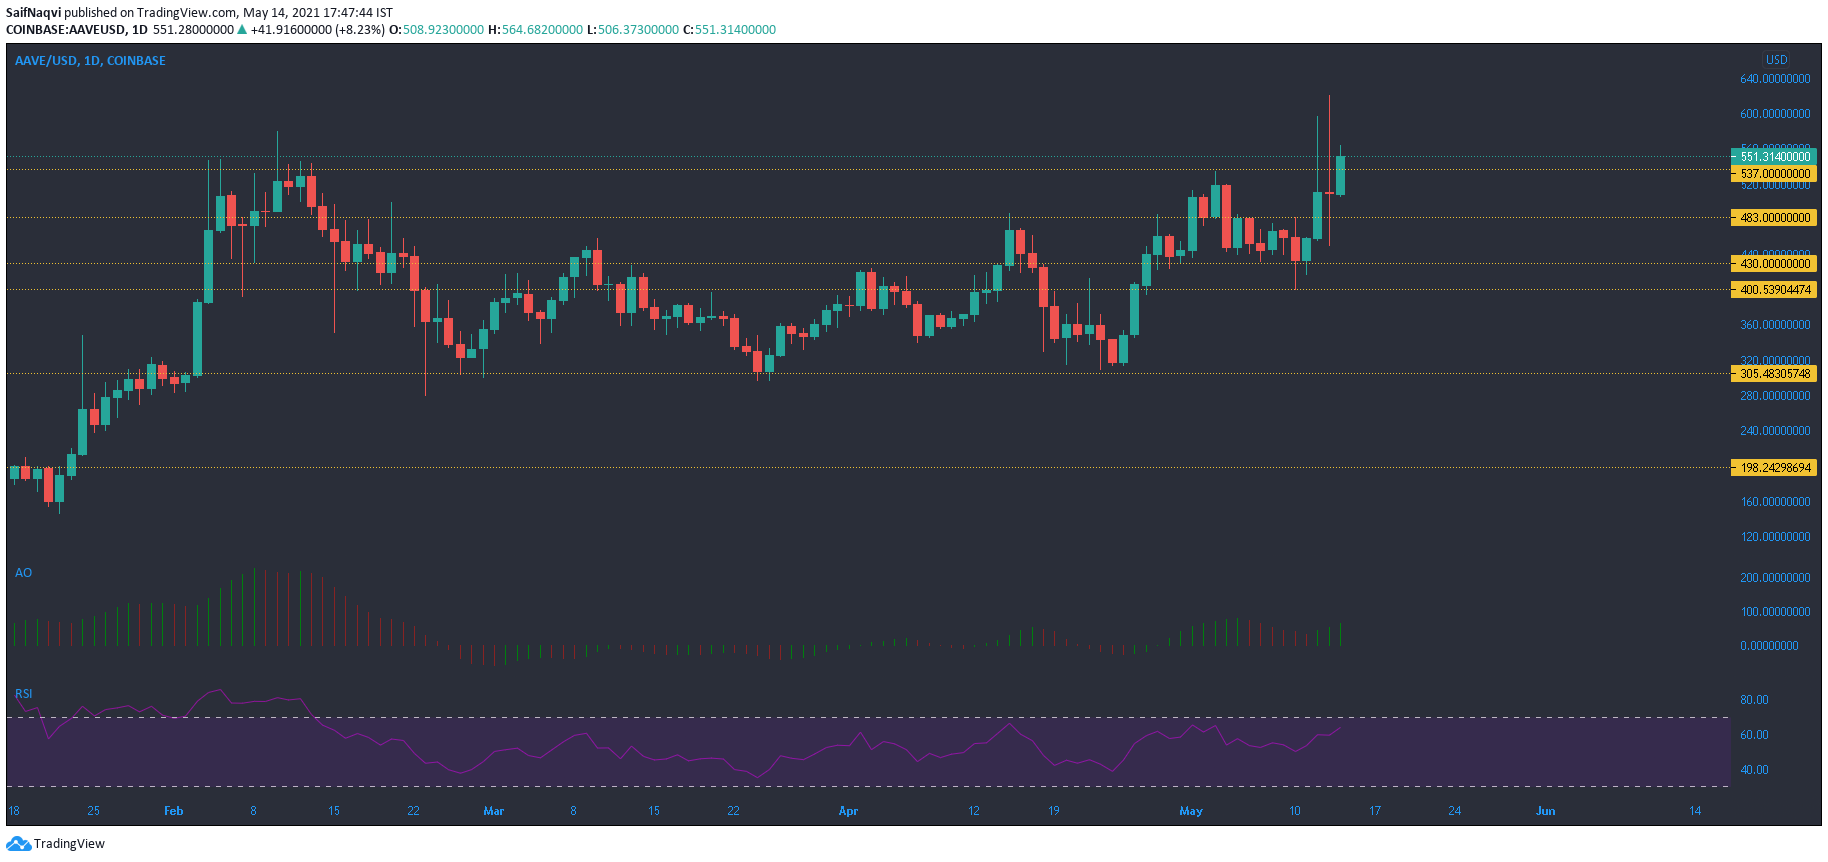
Aave’s daily timeframe noted an interesting development. After two consecutive bullish candlesticks, the formation of a doji candlestick hinted at an incoming pullback. However, the crypto-asset registered a series of green candlesticks on the 4-hour timeframe as buying activity picked up over the last 24 hours.
If today’s close results in a bull candle, the buyers would likely retain control of the market in the short term. This, however, would also be dependent on broader market cues. If Ethereum consolidates above $4K, AAVE would likely see rangebound movement of its own between $537-483.
The Awesome Oscillator’s green bars showed that market momentum rested with the buyers. To culminate into a price hike, the AO’s movement would need to be backed by strong volumes. Further strength was highlighted by the RSI being above 60.


