Litecoin [LTC] drops beneath range lows, could $50 be next

Disclaimer: The information presented does not constitute financial, investment, trading, or other types of advice and is solely the opinion of the writer.
Litecoin was on a downtrend leading into May, and in mid-May, it formed a range between the $60 and $74 levels. At press time, the price appeared set to drop further after closing a session beneath $60.
USDT dominance stood at 6%, at the time of writing, and has oscillated between the 5.84% and 6.5% levels over the past three weeks. If this metric does indeed advance, it would be a sign that capital was fleeing from the crypto-assets and into the stablecoin USDT, which is an indication of selling pressure.
LTC- 12-Hour Chart
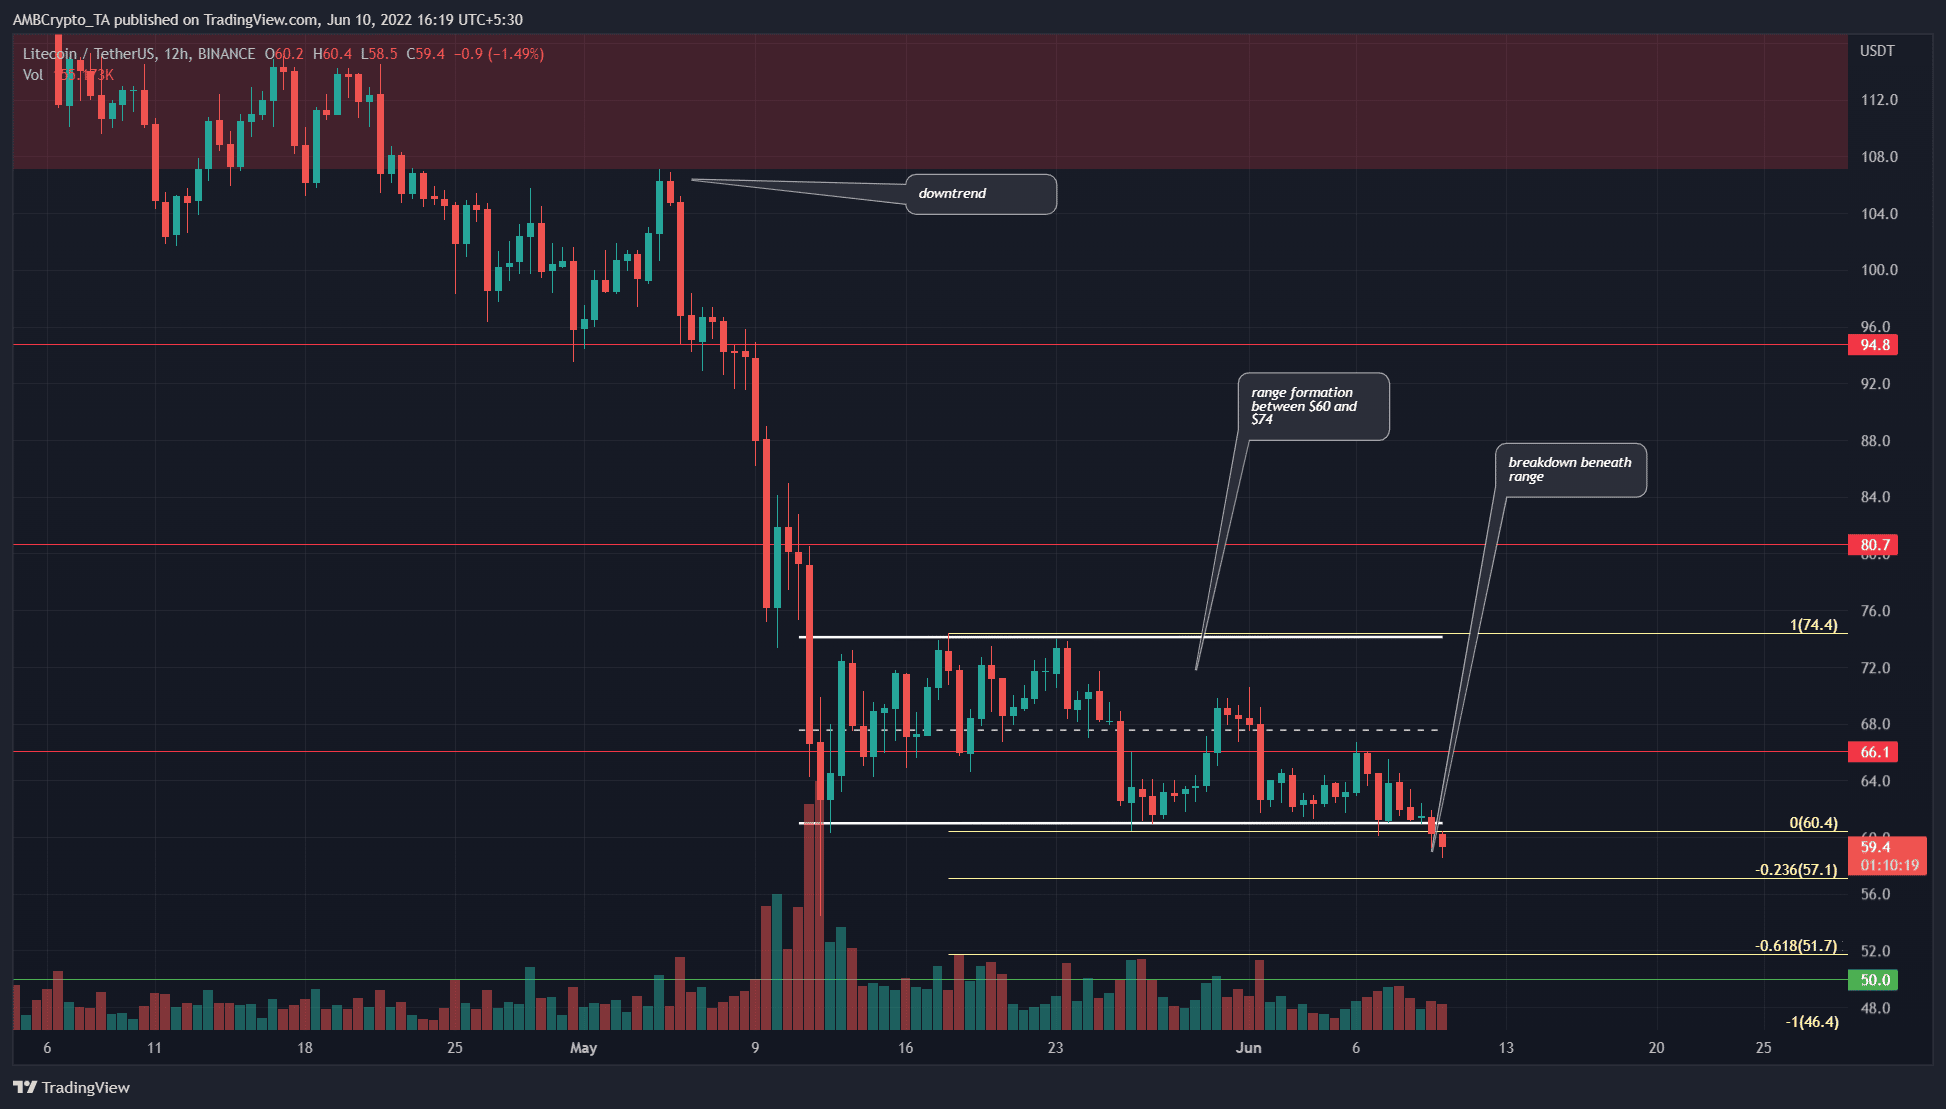
The trend has been downward for LTC since late November, and in April and May, the price was unable to defend both the $100 region as well as the $80 area. Both of these zones have been flipped from demand to supply zones, and the price continued to sink lower to the $60 mark.
In the past three weeks, the price appeared to form a range between $60 and $74 (white), with the midpoint at $67 which has served as both support and resistance in the same time period.
The previous day of trading saw LTC slip beneath the range lows and below the $60.4 mark. The Fibonacci extension levels (pale yellow) showed possible southward targets to be at $57.1, $51.7, and $46.4.
LTC- 4-Hour Chart
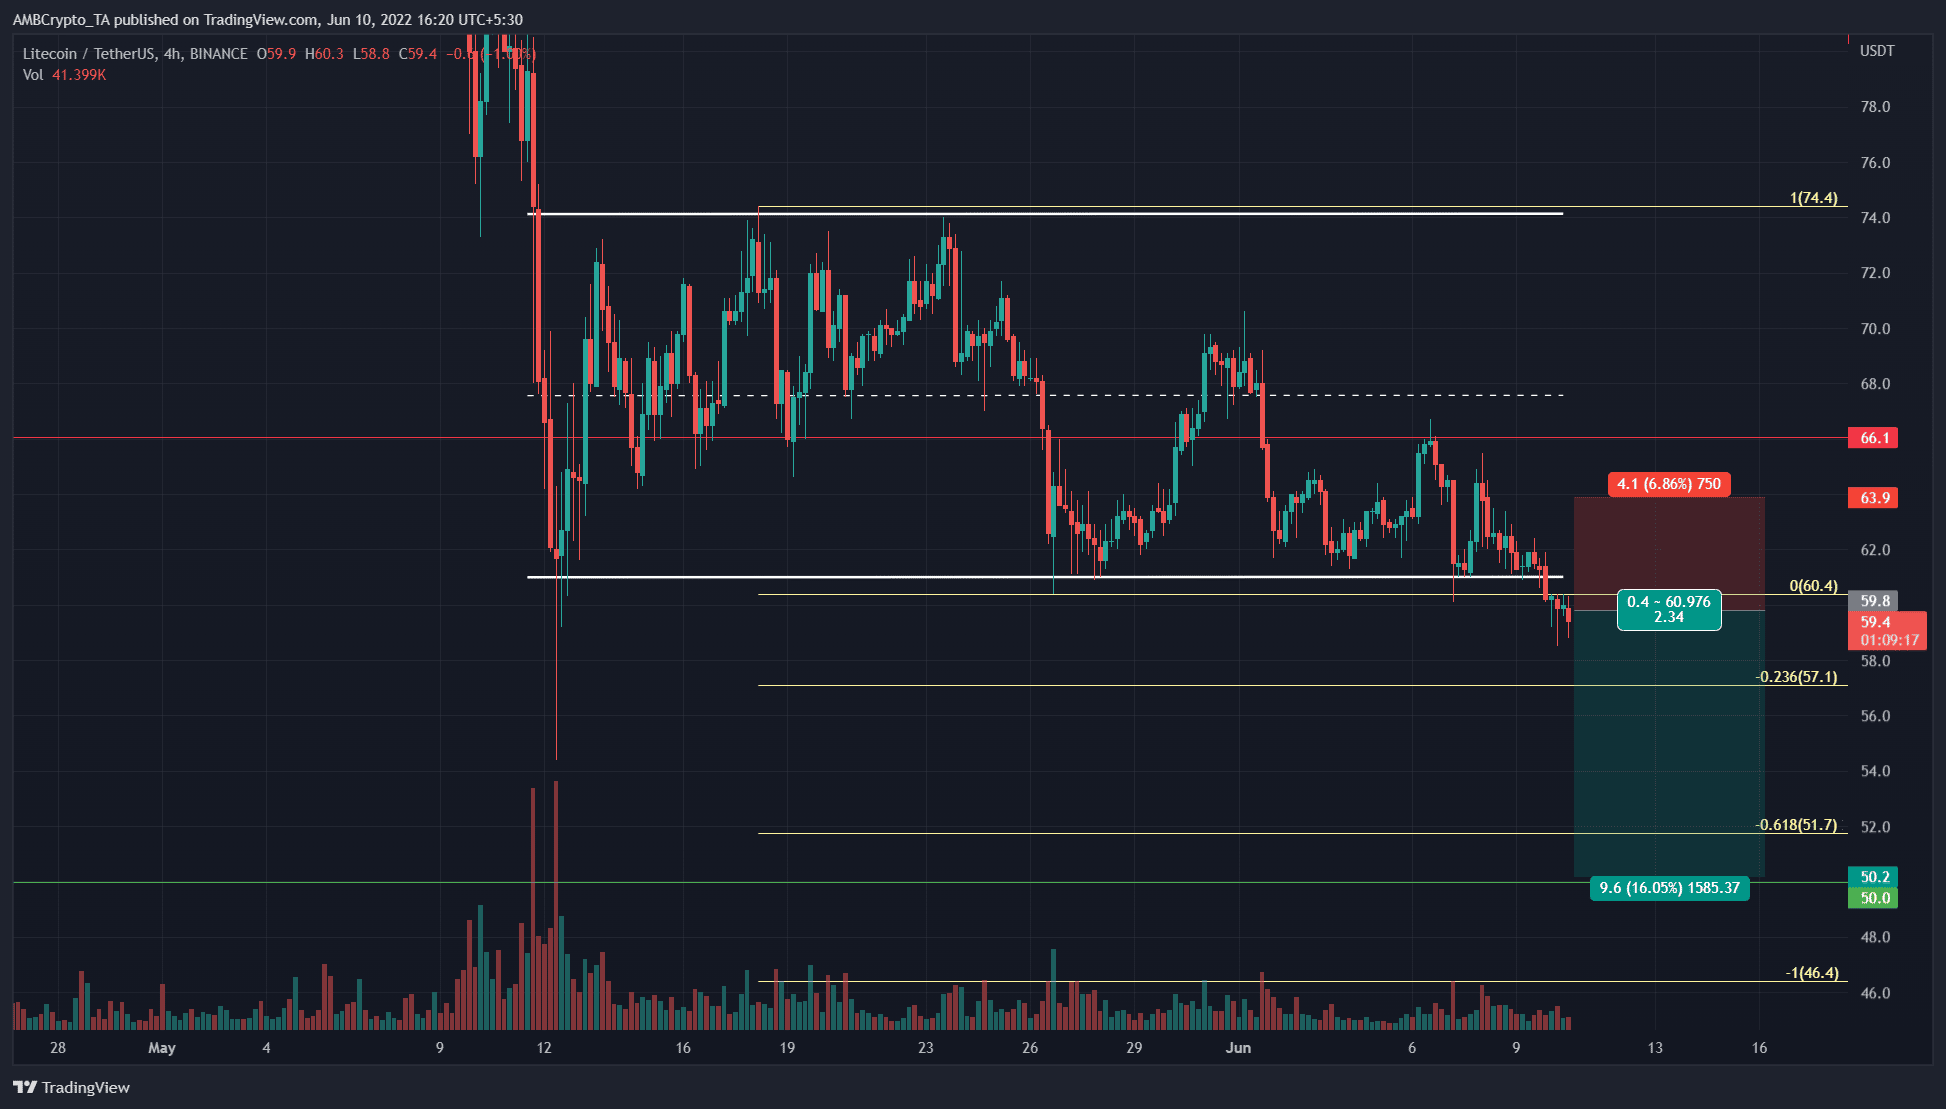
Zooming into the H4 chart, we can see that, apart from the Fibonacci extension levels, the $50 level has also been a strong higher timeframe support level.
A retest of the $60 mark could materialize in the next day or two, and an entry to a short position can be considered. A stop-loss can be set just above $62 for aggressive traders. Since the $63.5 area has acted as resistance in the past couple of days, a more lenient stop-loss can be set near the $64 mark as well. The $57, $51, and $50 levels can be used to take profit.
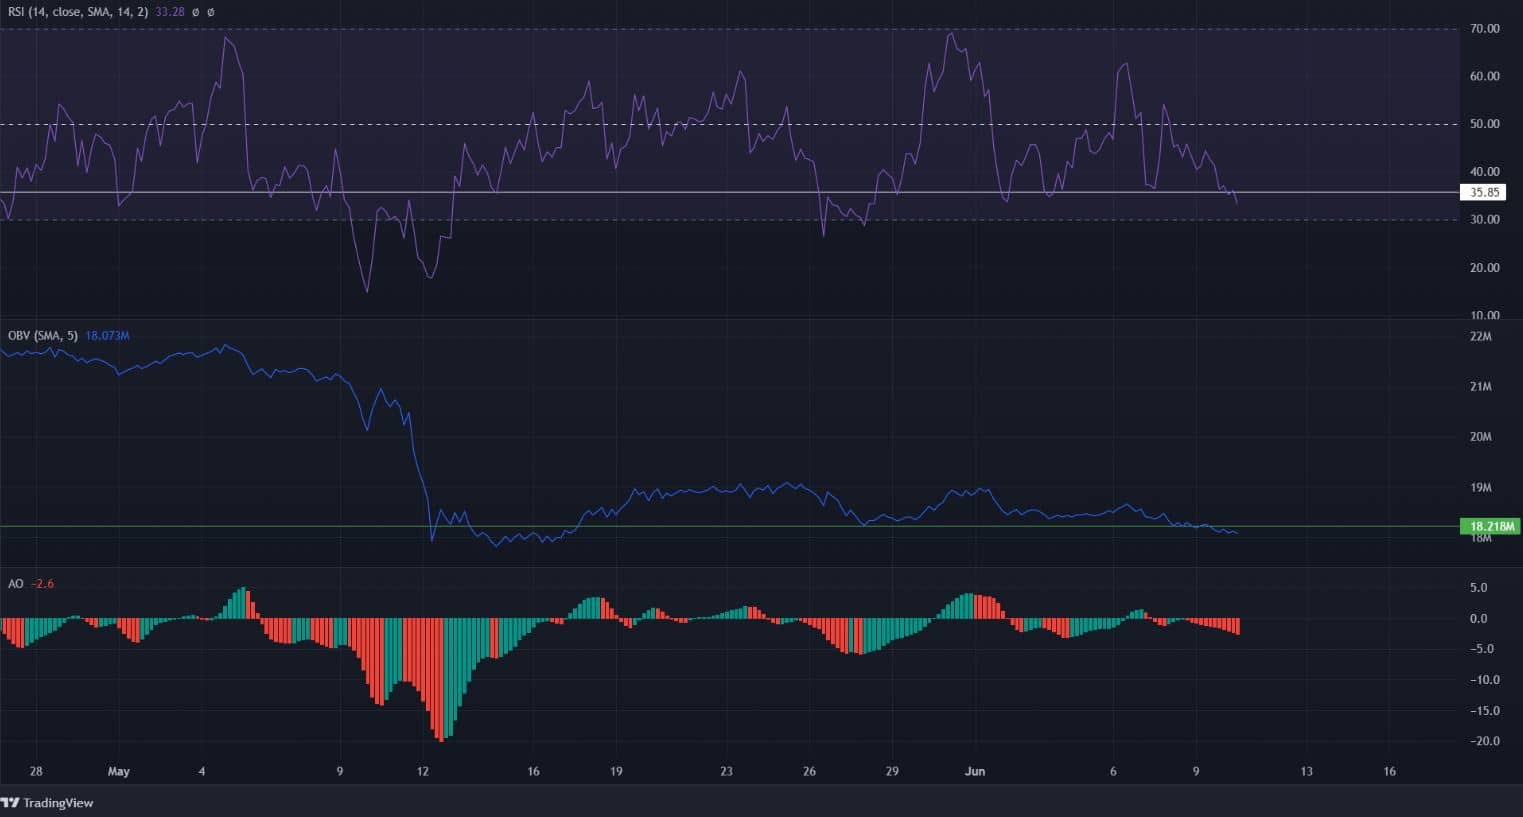
The H4 RSI was below the neutral 50 line and fell beneath the 35 mark in the past few hours of trading. This development indicated strong bearish momentum behind LTC. The Awesome Oscillator also formed red bars on its histogram, to show strengthening downward pressure.
On the OBV is marked a horizontal level (green) which has been defended, for the most part, throughout May. However, the previous two days of trading saw OBV slowly sink below the highlighted level.
Conclusion
The falling OBV and the downward RSI indicated that selling pressure was intense behind Litecoin. The higher timeframe price action showed the range lows being broken, adding further confluence to encourage shorting the asset. An entry could be taken near the $60 level. The $57, $51, and $50 levels can be used to take profit, with a conservative stop-loss at $63.9.