Amidst the current bearish market condition, Litecoin which is often referred to as the silver to Bitcoin’s gold didn’t fail to bring joy to its investors. The altcoin registered massive gains over the last seven days.
Here’s AMBCrypto’s Price Prediction for Litecoin for 2023-24
More good news came in for LTC when the coin was listed among the top cryptos in terms of Galaxy Score, which is a promising bullish signal.
Current top 10 coins by LunarCrush Galaxy Score™:
1️⃣ $collie
2️⃣ $flux
3️⃣ #amplifi
4️⃣ $nebl
5️⃣ $clo
6️⃣ $ltc
7️⃣ $wtk
8️⃣ $okb
9️⃣ $snm
? $ambhttps://t.co/BFkfJIFO20— JU’MetaAsset (@Jeedjameel) October 26, 2022
Additionally, Litecoin was also listed on Blockbank, a CeFi and DeFi platform. This new listing will not only help LTC increase its reach, but will also allow new investors to enter the Litecoin ecosystem.
NEW LISTING: @Blockbankapp crypto users can now buy and trade #Litecoin⚡ https://t.co/dsD6LhP79d
— Litecoin (@litecoin) October 26, 2022
Now, you might ask if LTC’s pump was because of its ecosystem-centric developments, or if it was just a consequence of Bitcoin’s price surge. Well, a look at its metrics will reveal the answer. But one point to be noted here is that at press time, LTC was trading at $56.52, nearly 10% more than the last week, which was higher than that of Bitcoin’s 7-day value.
Not all were in favor
LTC’s on-chain metrics provided some clarity on the matter, as a few of them were backing the surge, while the others were indicating a trend reversal.
LTC’s MVRV Ratio went up considerably over the last week, which is a bullish sign. Moreover, the coin’s volume was also in its support as it increased along with the MVRV Ratio.
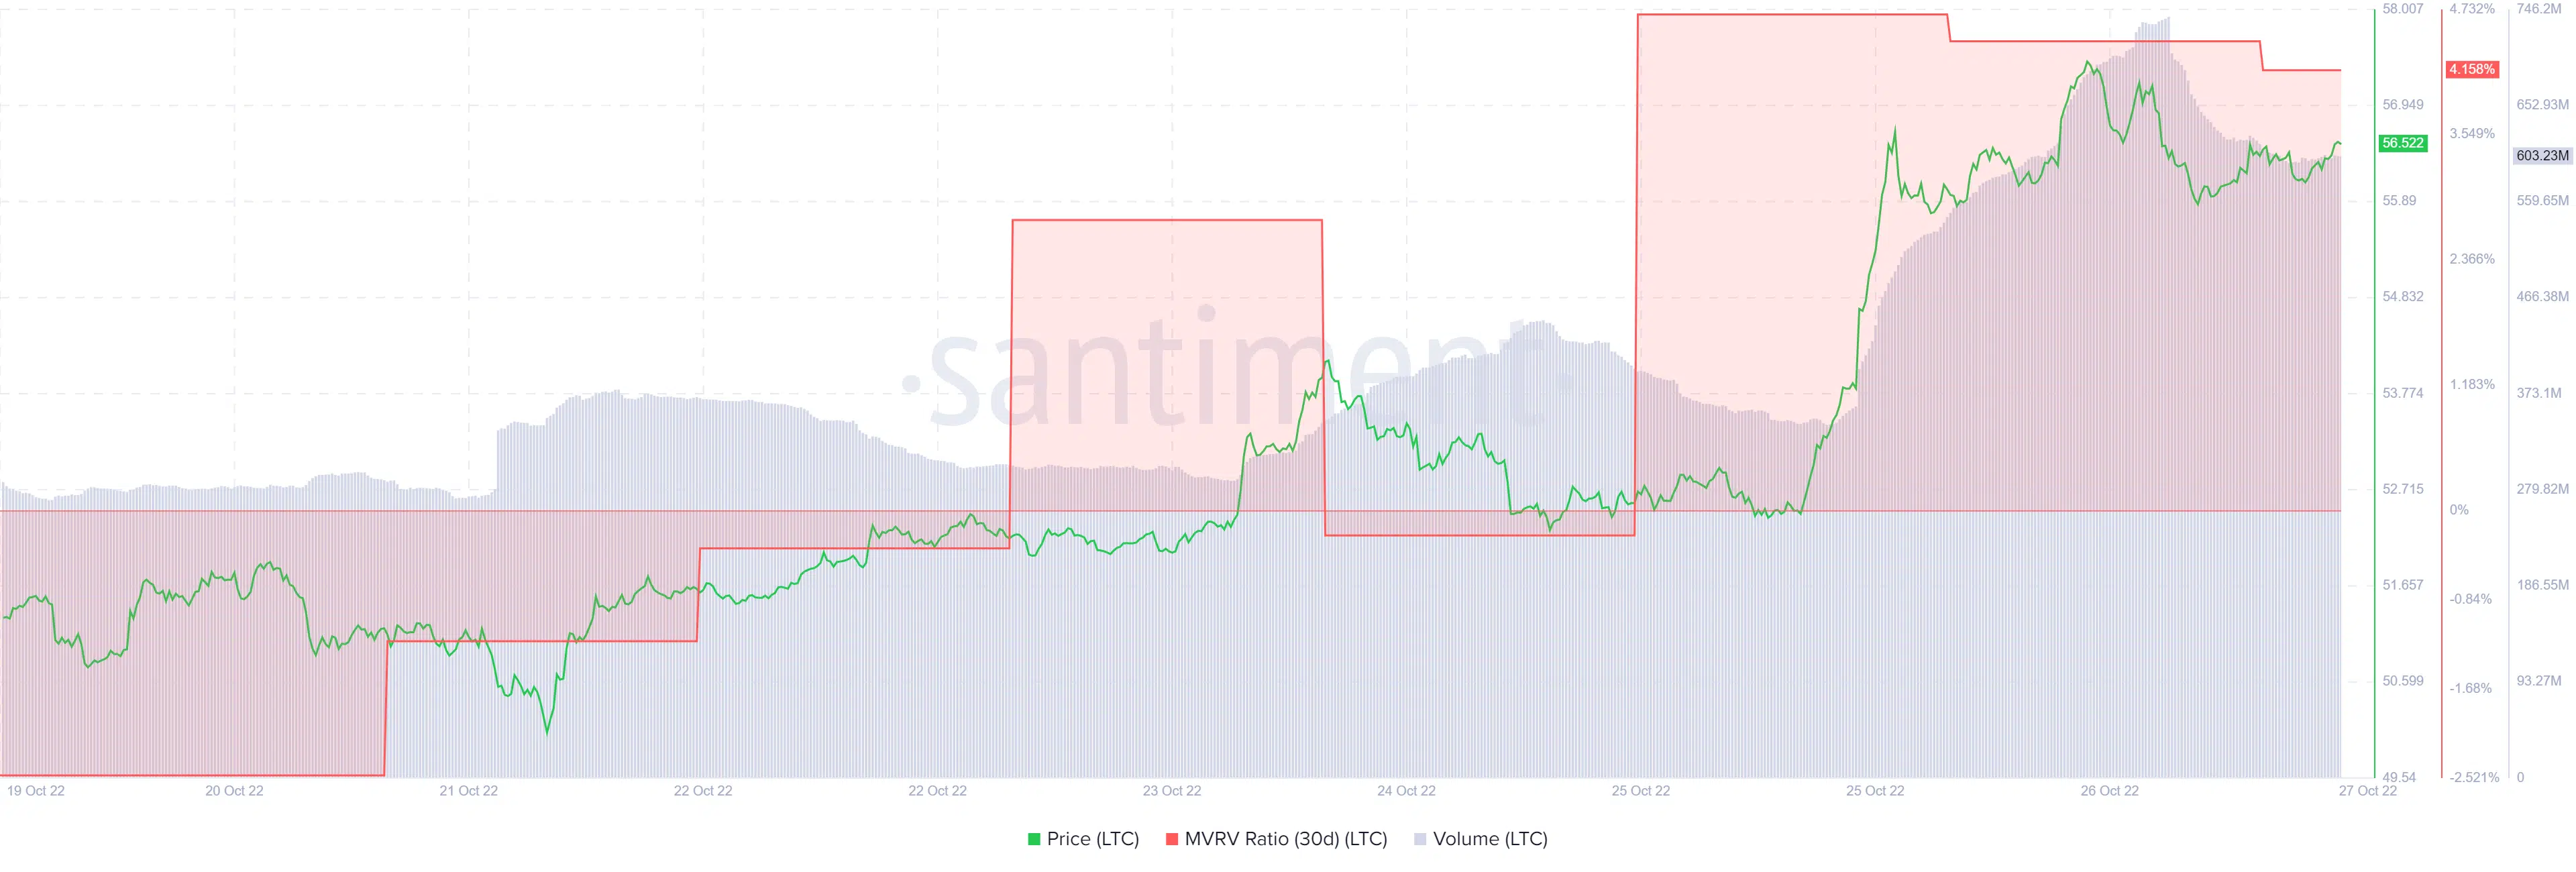
Source: Santiment
Nonetheless, Glassnode’s data revealed a different story for Litecoin. LTC’s number of receiving addresses registered a decline over the last few days, which is a negative signal.
Not only this, but Litecoin’s reserve risk spiked lately, indicating investors’ low confidence.
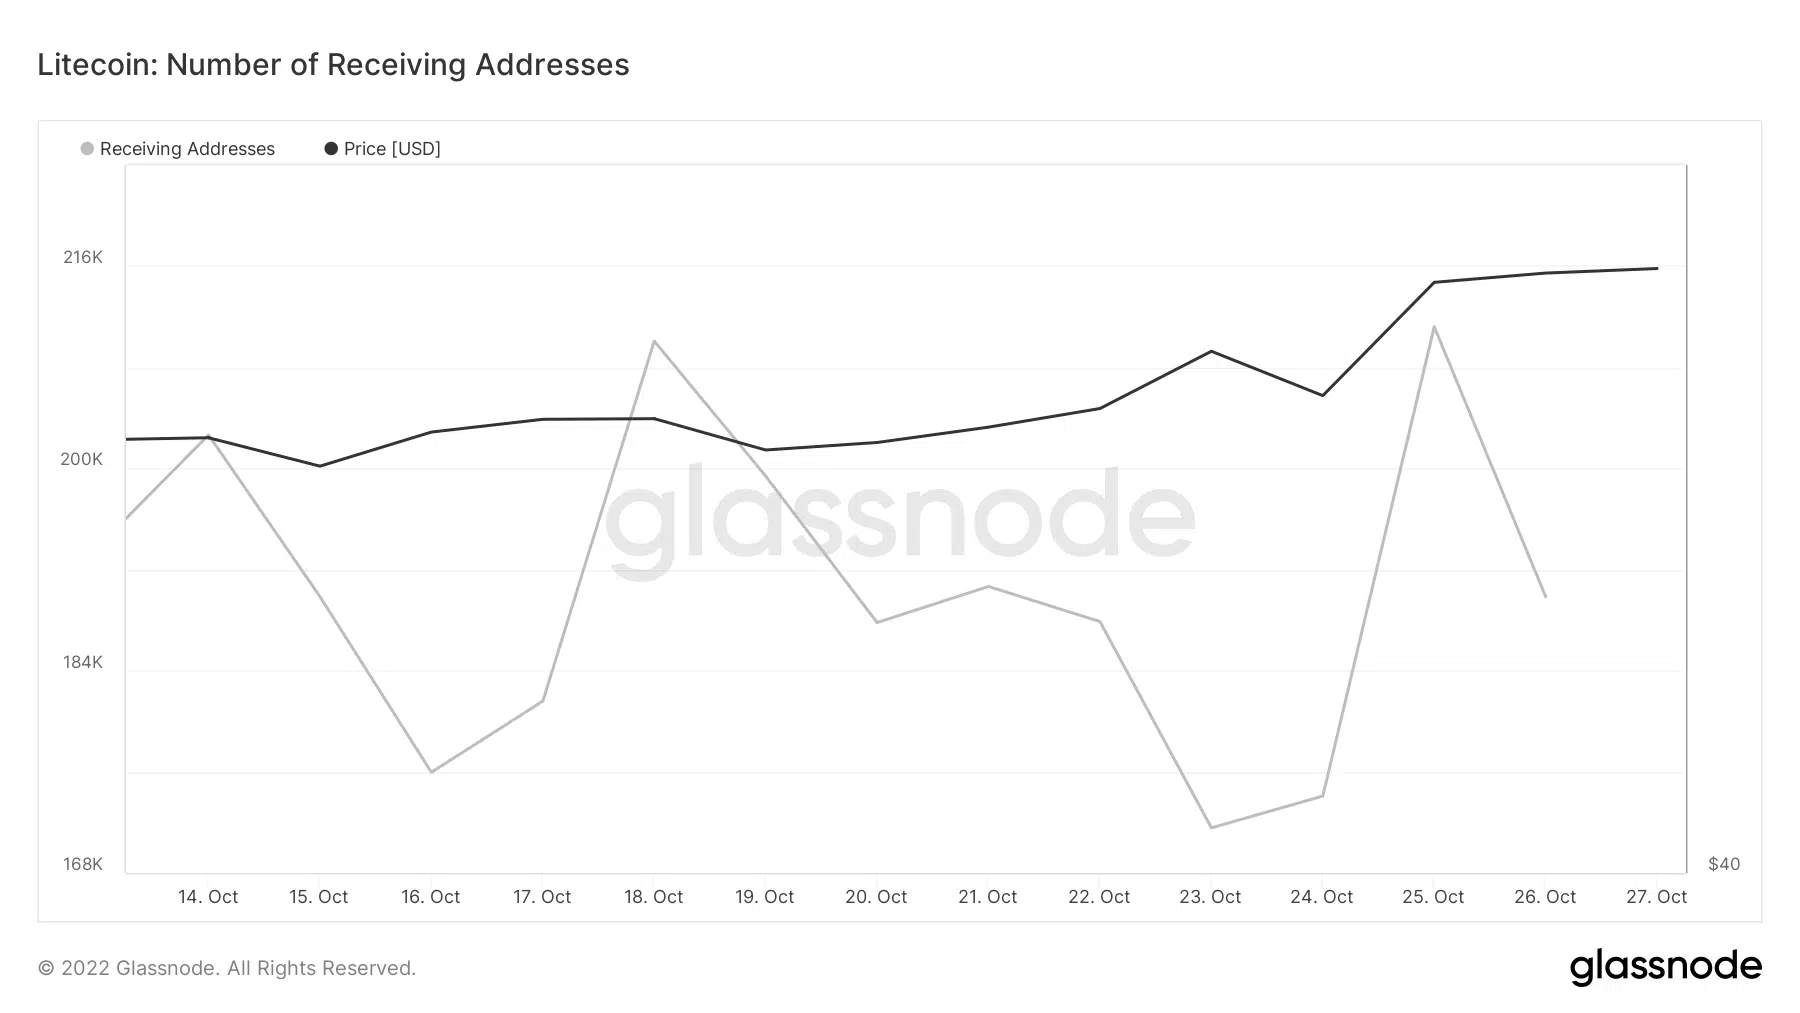
Source: Glassnode
No! LTC’s pump is for real
Investors might get happy as LTC’s daily chart suggested that the pump was not just a mere consequence of the bullish market as several market indicators were sporting a further northbound movement.
Both the Relative Strength Index (RSI) and Chaikin Money Flow (FLOW) were hovering above the neutral position, which is a bullish signal.
In addition to that, the 20-day Exponential Moving Average (EMA) (Green) was fast approaching the 50-day EMA (Red), increasing the chances of a bullish crossover in the coming days.
The Bollinger Band revealed that LTC’s price was about to enter a high volatility zone. Combining all the market indicators, a continued price surge was likely, which should elate investors.
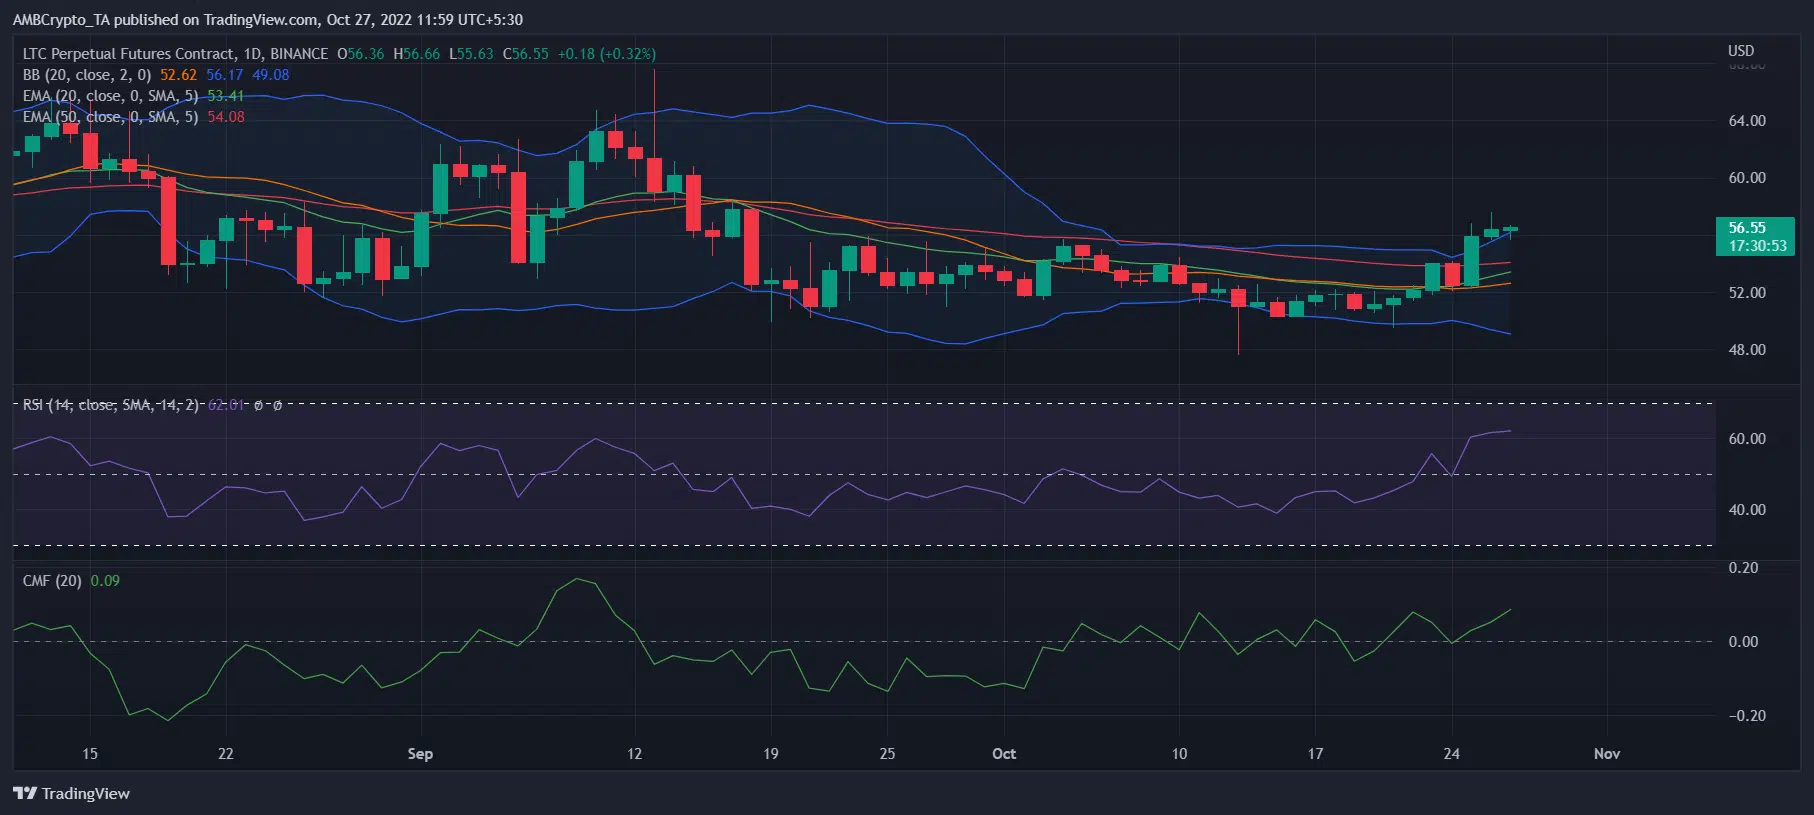
Source: TradingView