Litecoin [LTC] short-sellers should take note of these levels for good returns

After dropping from its May 2021 ATH, Litecoin [LTC] bears ramped up their consistent efforts to close below the $91-$104 range for nearly a year. The altcoin’s extremely high correlation with Bitcoin subjected it to market-wide liquidations over the last few months.
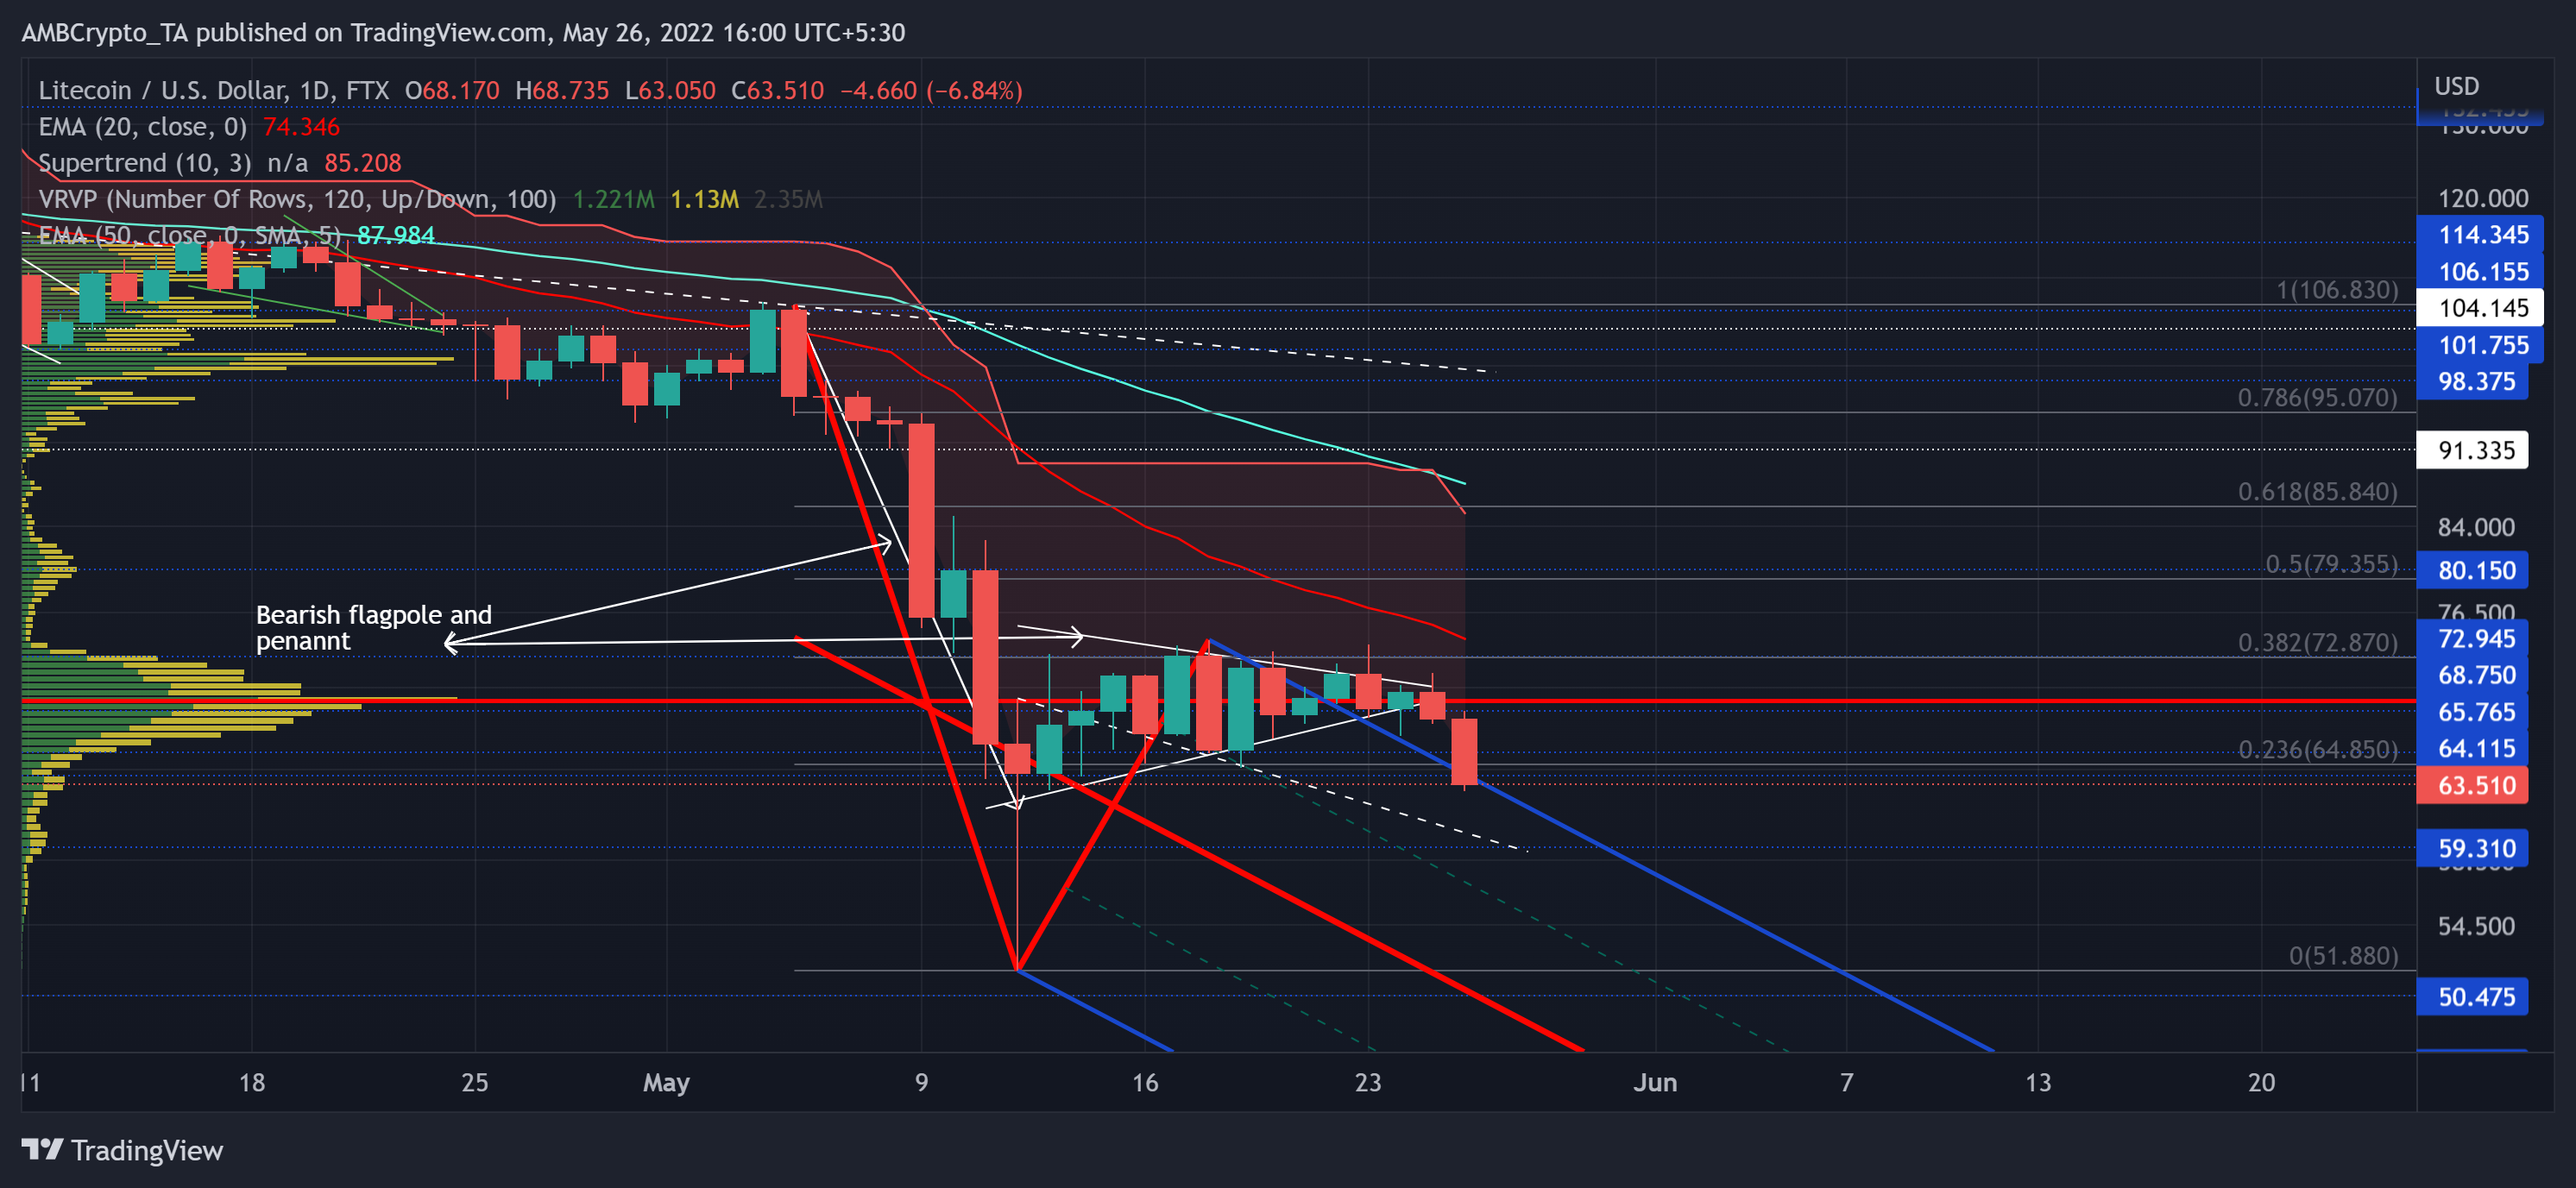
Thus, the drop below the $91-level has set LTC in a heightened bearish motion. A potential close below the upper trendline of the Pitchfork could confirm the sturdiness of the bearish pennant down breakout. And with it, a further downside in the coming times.
At press time, LTC traded at $63.51, down by 8.27% in the last 24 hours.
LTC Daily Chart
The buying structure wobbled after a strong pullback from the $132-resitance on 31 March. LTC hasn’t been able to advance above key price levels ever since.
After the buyers failed to protect the $91-$98 range, LTC saw an over 51% loss to its 18-month low on 12 May. During this fall, the 50% and the 38.2% Fibonacci resistance stood quite well to curb all the buying rallies.
As a result, the gap between the 20 EMA (red) and the 50 EMA (cyan) has overstretched to its record high. With the 20 EMA still looking south, the buying comebacks would be relatively brittle. To top this up, the Supertrend steeply looked south. Such steep-looking tendencies have more often than not accompanied a string of bearish engulfing candlesticks in the past.
Taking note of these indications, a sustained fall below the $63-level would pave a path toward the $50-mark in the coming sessions. With relatively lesser volumes around this range, the buyers could find it difficult to stop the bleeding.
However, for any potential short calls, the traders/investors must wait for a robust close below the upper boundary of Pitchfork.
Rationale
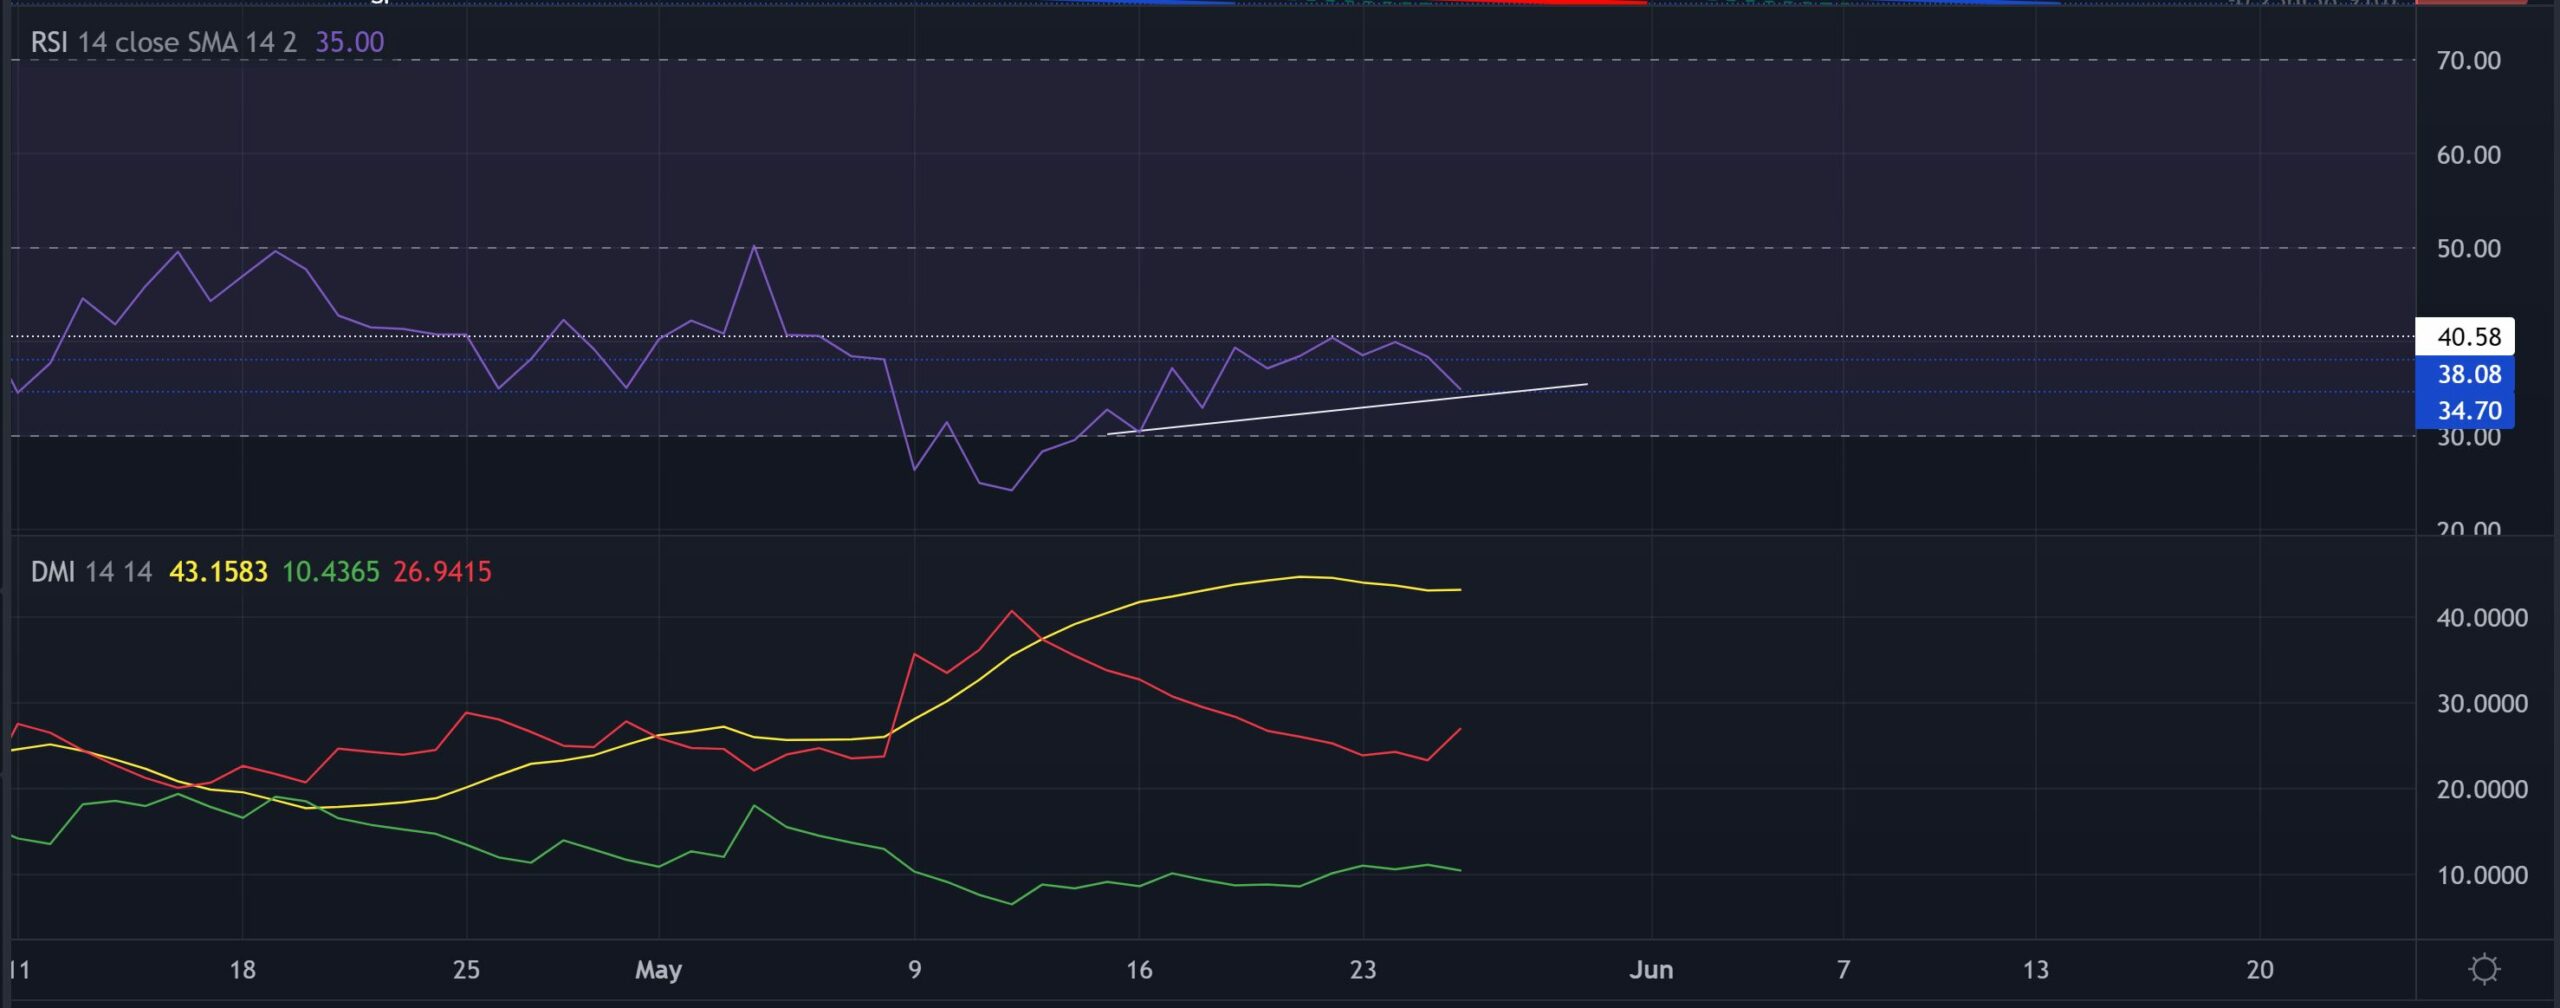
The Relative Strength Index turned its back on the 40-mark ceiling after multiple buying efforts to topple it.
From this forth, RSI recovery from the 38-support would be critical to reignite near-term buying tendencies. Any price recovery from the $59-level could lead to a potential bullish divergence.
But with the DMI exhibiting its strong bearish stance, the buyers would face a tough time turning the tide in their favor.
Conclusion
The current bearish pennant down breakout would find more thrust should the price action find a robust close below the $59-$63 range. In this case, the traders aim to enter a short call with a take profit near the $50-$51-range.
Nevertheless, LTC shares a staggering 98% 30-day correlation with the king coin. A close eye on Bitcoin’s movement would be imperative to make a profitable move.


