Litecoin [LTC] traders must consider this before entering a position

Disclaimer: The findings of the following analysis are the sole opinions of the writer and should not be considered investment advice.
The recent market-wide drawdowns helped Litecoin [LTC] sellers to pull the alt toward its 19-month support in the $61-zone. Thus, it quickly plunged below its trendline resistance while witnessing a bearish pennant breakdown on the daily chart.
A potential close below the immediate support could heighten the chances of a $57-$59 range retest. At press time, LTC traded at $61.95.
LTC Daily Chart
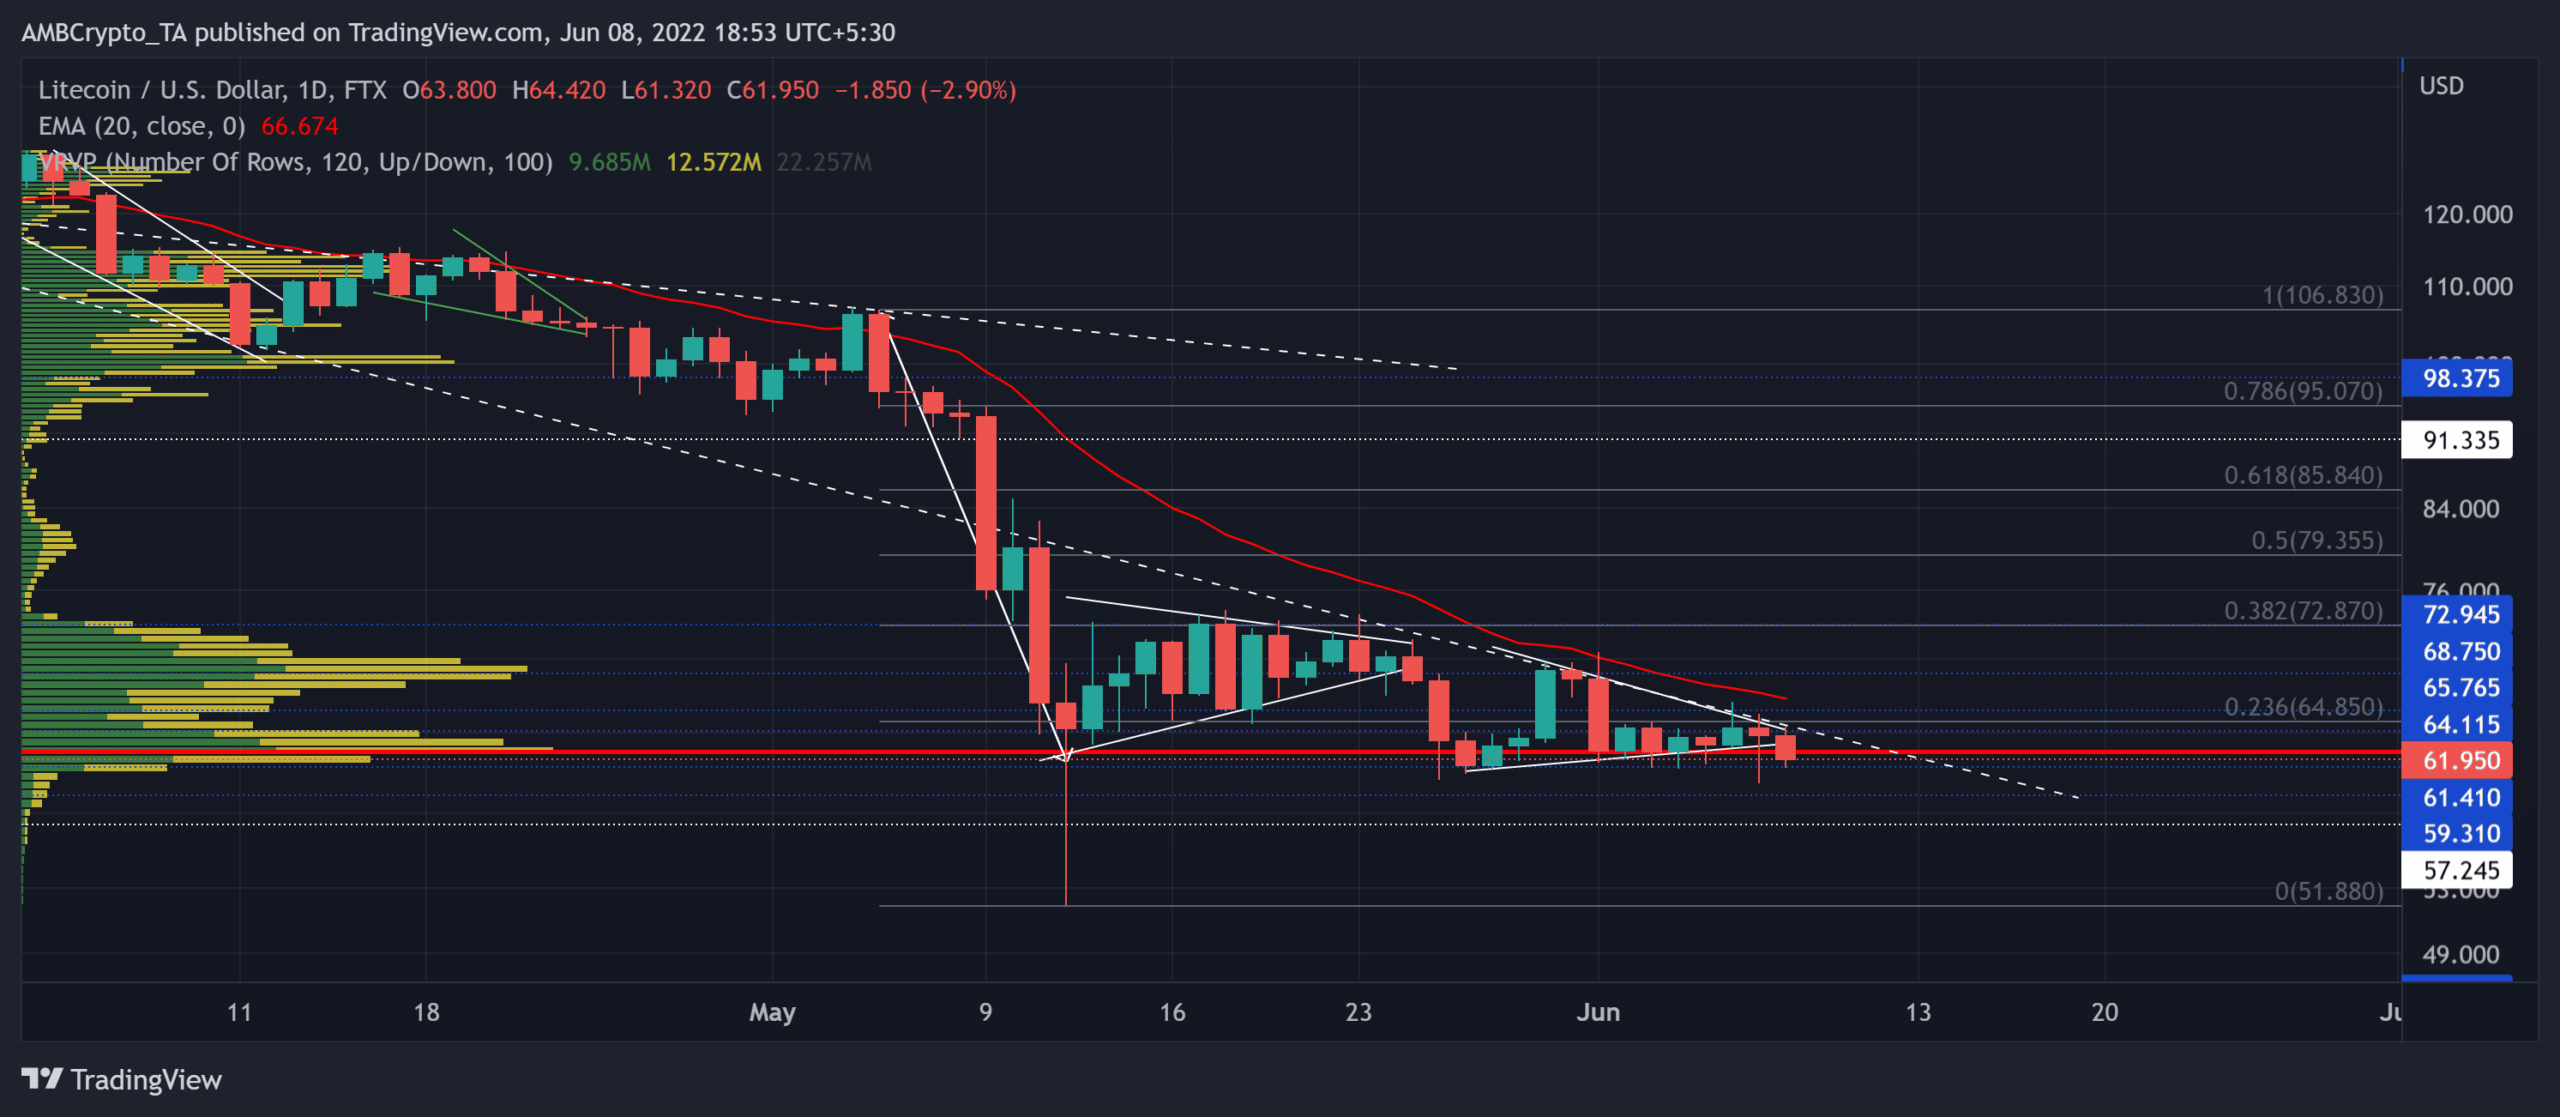
The altcoin’s aggravated bearish drop from the $98-mark has pulled LTC below its 11-week trendline resistance (white, dashed). With the Point of Control (POC, red) offering the highest level of liquidity, the alt has been extending its compression phase.
The 38.2% and the 23.6% Fibonacci level have curbed buying rallies during LTC’s revival from its 18-month low on 12 May.
With the 20 EMA (red) still looking south, the buying comebacks still needed to record higher trading volumes. Furthermore, the short symmetrical triangle’s breakdown could provoke a short-term downside. The buyer’s ability to hold the immediate grounds could see an extended squeeze phase near its POC in the coming sessions.
Any close below the $64.1-mark could lead LTC to test the $57-mark before the bulls aim to retest the trendline resistance. The bulls needed to close above the 20 EMA to affirm any recovery chances in the days to come.
Rationale

The Relative Strength Index (RSI) has been rebounding from the 40-mark resistance for the last month. Thus, depicting a bearish edge in the near term.
While the Aroon up (yellow) hovered near the 0%-30% range, the sellers claimed an edge in the current market structure.
However, the bullish divergence on the OBV could help the buyers hold on to the $64-zone and continue the tight phase.
Conclusion
Placing long bets against the trend may not be profitable yet, especially with the weak readings on the indictors.
A close beyond the $64-zone would open up near-term retracement prospects toward the $57-$59 range. The alt would likely enter a squeeze phase until the buyers consistently ramp up the buying volumes.
At last, LTC shares a 36% 30-day correlation with the king coin. A close eye on Bitcoin’s movement would be imperative to make a profitable move.