Litecoin, Matic, Tron Price Analysis: 26 May

Digital silver, Litecoin along with other altcoins like Polygon’s MATIC has been losing correlation with the largest cryptocurrency, Bitcoin. This loss of correlation has helped its price rally along with Ethereum. Meanwhile, mid-cap asset Tron [TRX] was still trying to ward off the bears in the market.
Litecoin [LTC]

Source: LTCUSD on TradingView
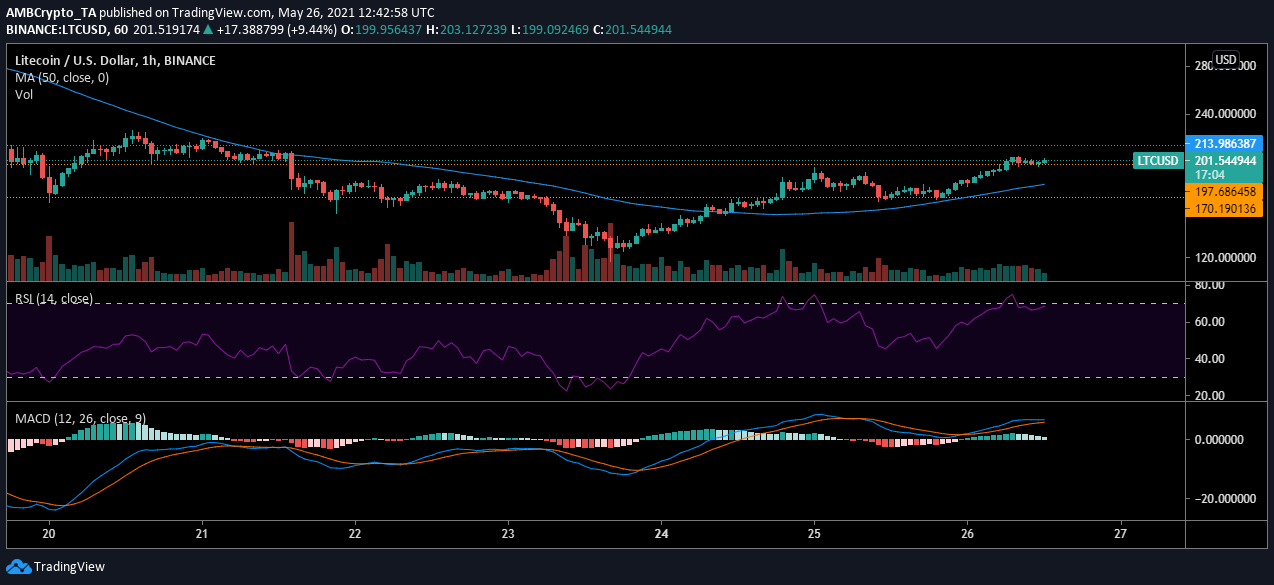
Litecoin’s price still appeared to be rising higher in the short term. The asset met resistance at $197, after which it was consolidating and formed strong support at $170. However, the price once again climbed higher and breached resistance at $197. However, at press time a correction pushed LTC value to $192 while the indicators suggested an unstable market.
Despite value breaking under $197, buyers in the market took this opportunity to enter the market. Relative strength index suggested that the asset remained in the overbought zone when it was trading above $197. This value was considered really high and indicated market saturation. As price fell, RSI shot down to 53 and the traders were trying to establish support at this level.
Meanwhile, MACD line was intertwined with the signal line as the traders picked sides.
Polygon [MATIC]

Source: MATICUSD on TradingView
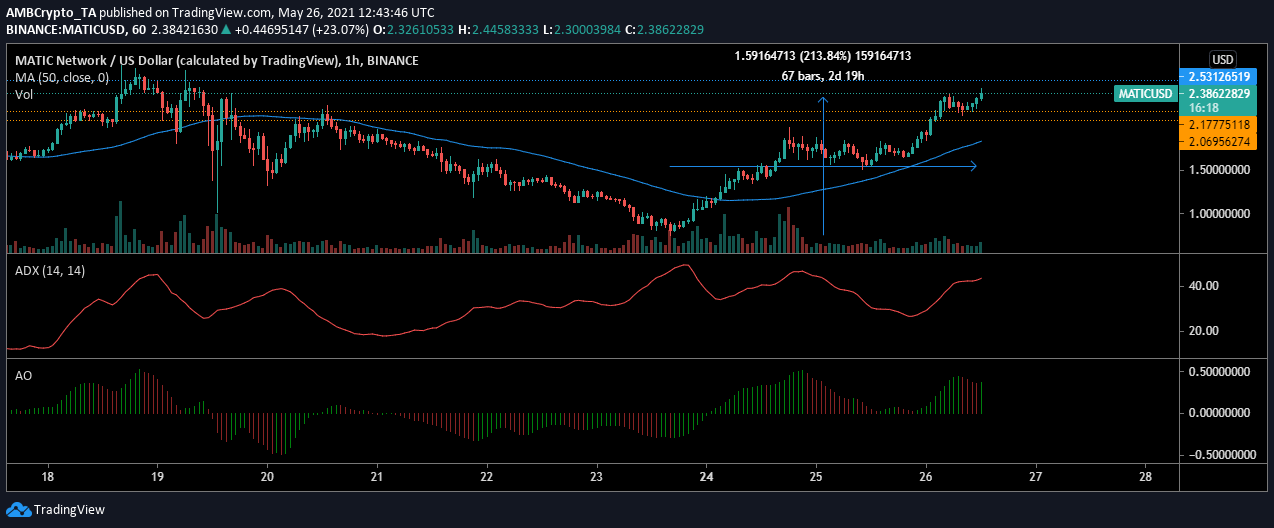
MATIC’s price can be seen gradually falling in the hourly chart above. However, the asset made a +200% recovery from its recent bottom and was currently trading at $2.16. As the price traded close to the support at $2.17, there were chances that the price may begin consolidating above this level.
The current bullishness of price could add to the market sentiment and push MATIC above $217 shortly. ADX at 40 was showing strong support to the ongoing bullish trend in the market, although momentum was reducing. The reducing momentum could be a sign of consolidation.
Tron [TRX]

Source: TRXUSD on TradingView
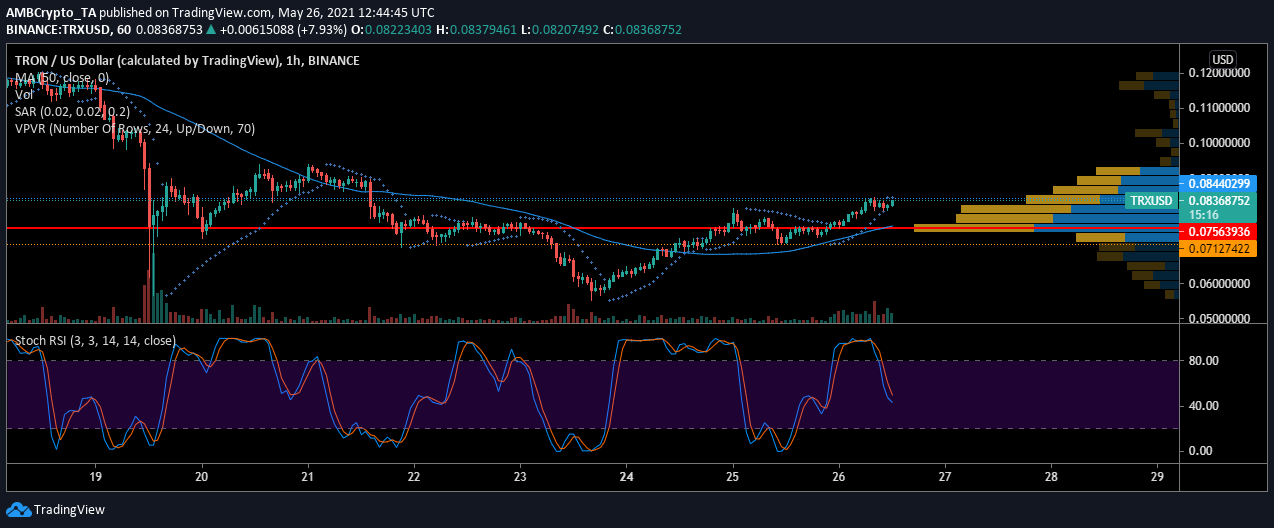
Unlike the bullish trend in most altcoin markets, Tron was suggesting a strong bearishness. The asset remained under $0.0844 despite repeated attempts. Visible range suggested that the prominent trading range for Tron has remained at $0.0756, but trading activity was also seen rising at the current price.
Nevertheless, volume has remained restricted at the time of press and has visibly increased in case of a sell-off. Markers of the Parabolic SAR indicator aligned above the candlesticks. These markers highlighted the restricted price. Stochastic RSI has already hit the oversold zone and was still pointing lower. This could lead to another sell-off and could push TRX down to $0.0770.


