
Litecoin formed a rising wedge pattern and could dip back to $217 in the coming hours, although its long-term outlook remains bullish. Monero was forming what appeared to be an ascending triangle pattern. Chiliz bulls quickly bought up a drop to $0.38 to reclaim the $0.47 support.
Litecoin [LTC]
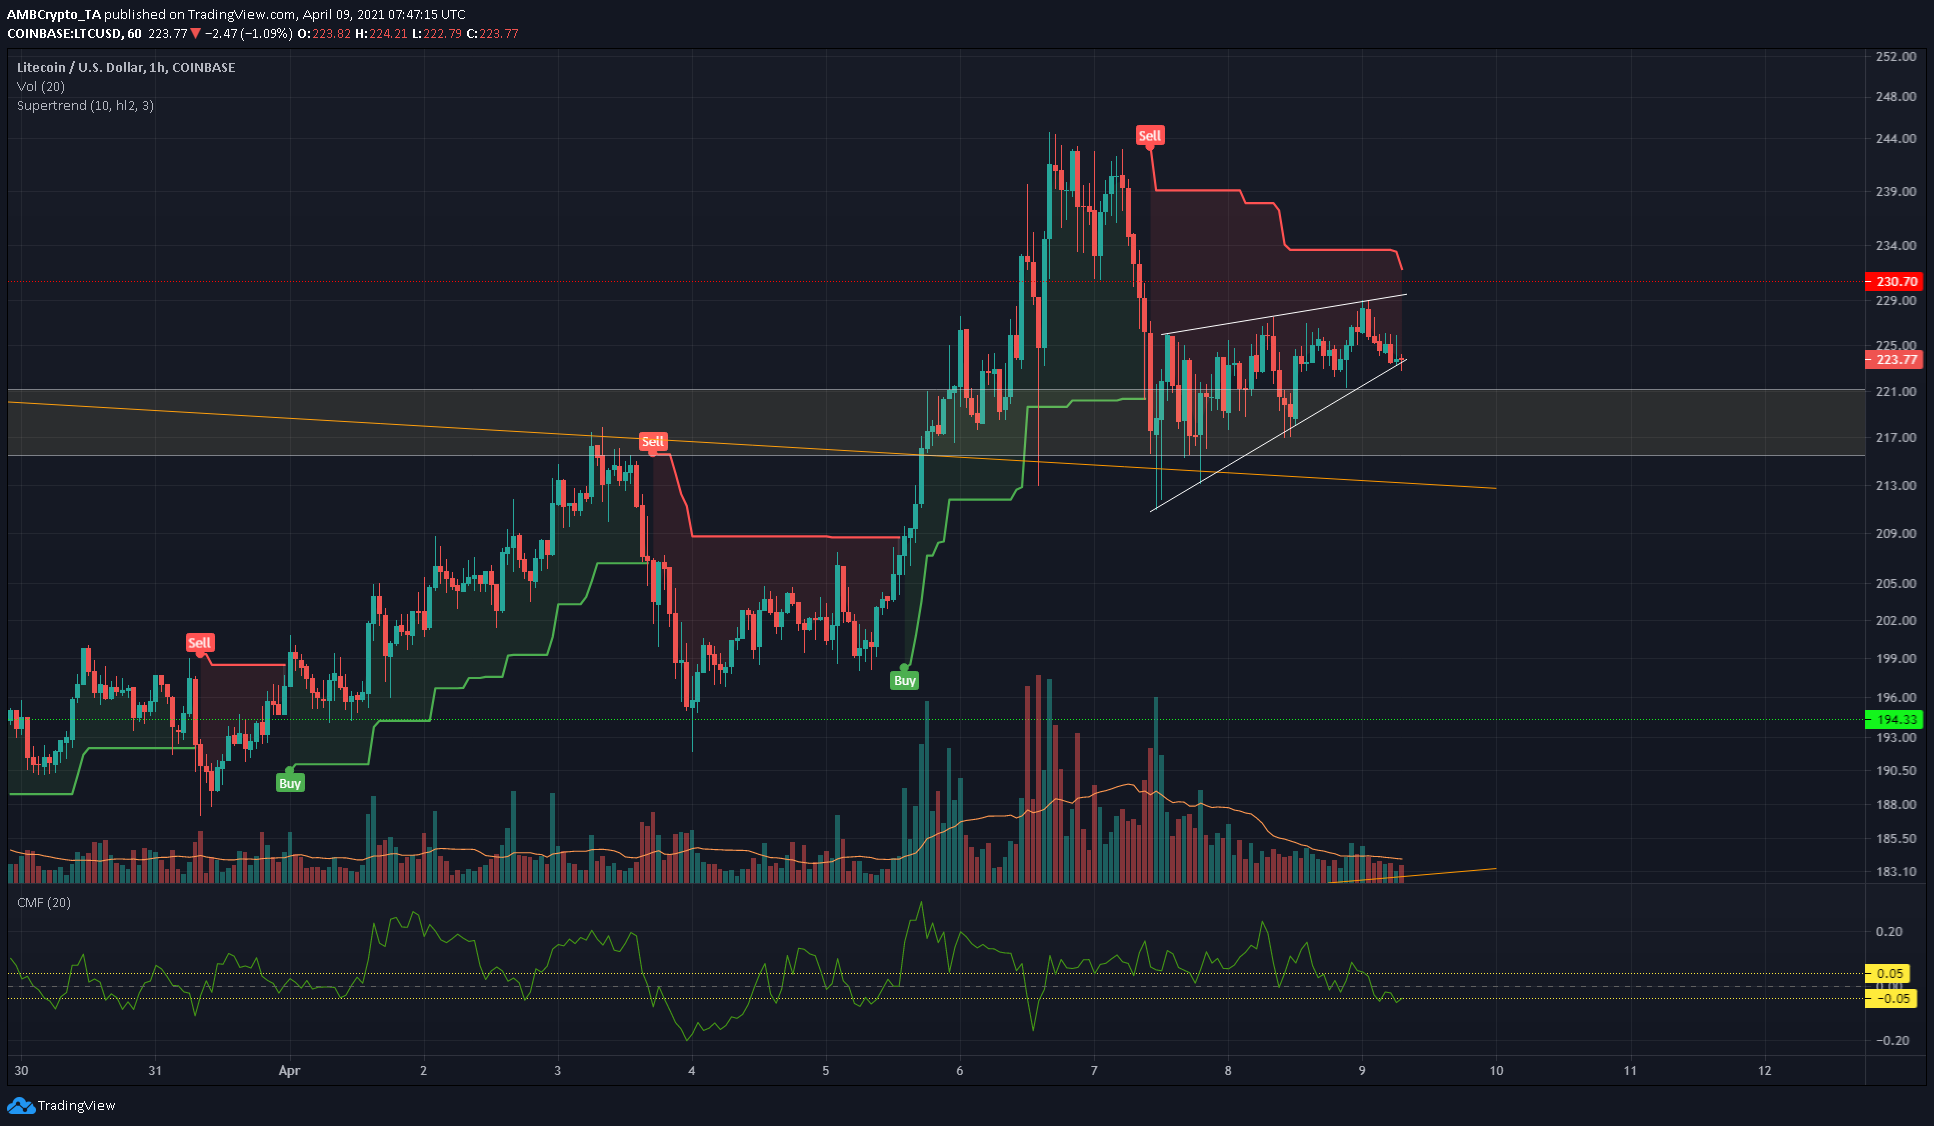
Source: LTC/USD on TradingView
LTC formed a rising wedge on the hourly chart. This could see it drop back into the demand zone, and could dip as far south as $210. The Chaikin Money Flow was near the -0.05 value, and moving lower would indicate that the capital leaving the market was greater than the capital entering the market, a sign of seller dominance. The Supertrend indicator continued to show a sell signal for LTC.
Despite the short-term bearish outlook for LTC, it has just moved upside of a symmetrical triangle it has traded within since February. This move could see LTC move toward $300 in the weeks to come.
Monero [XMR]
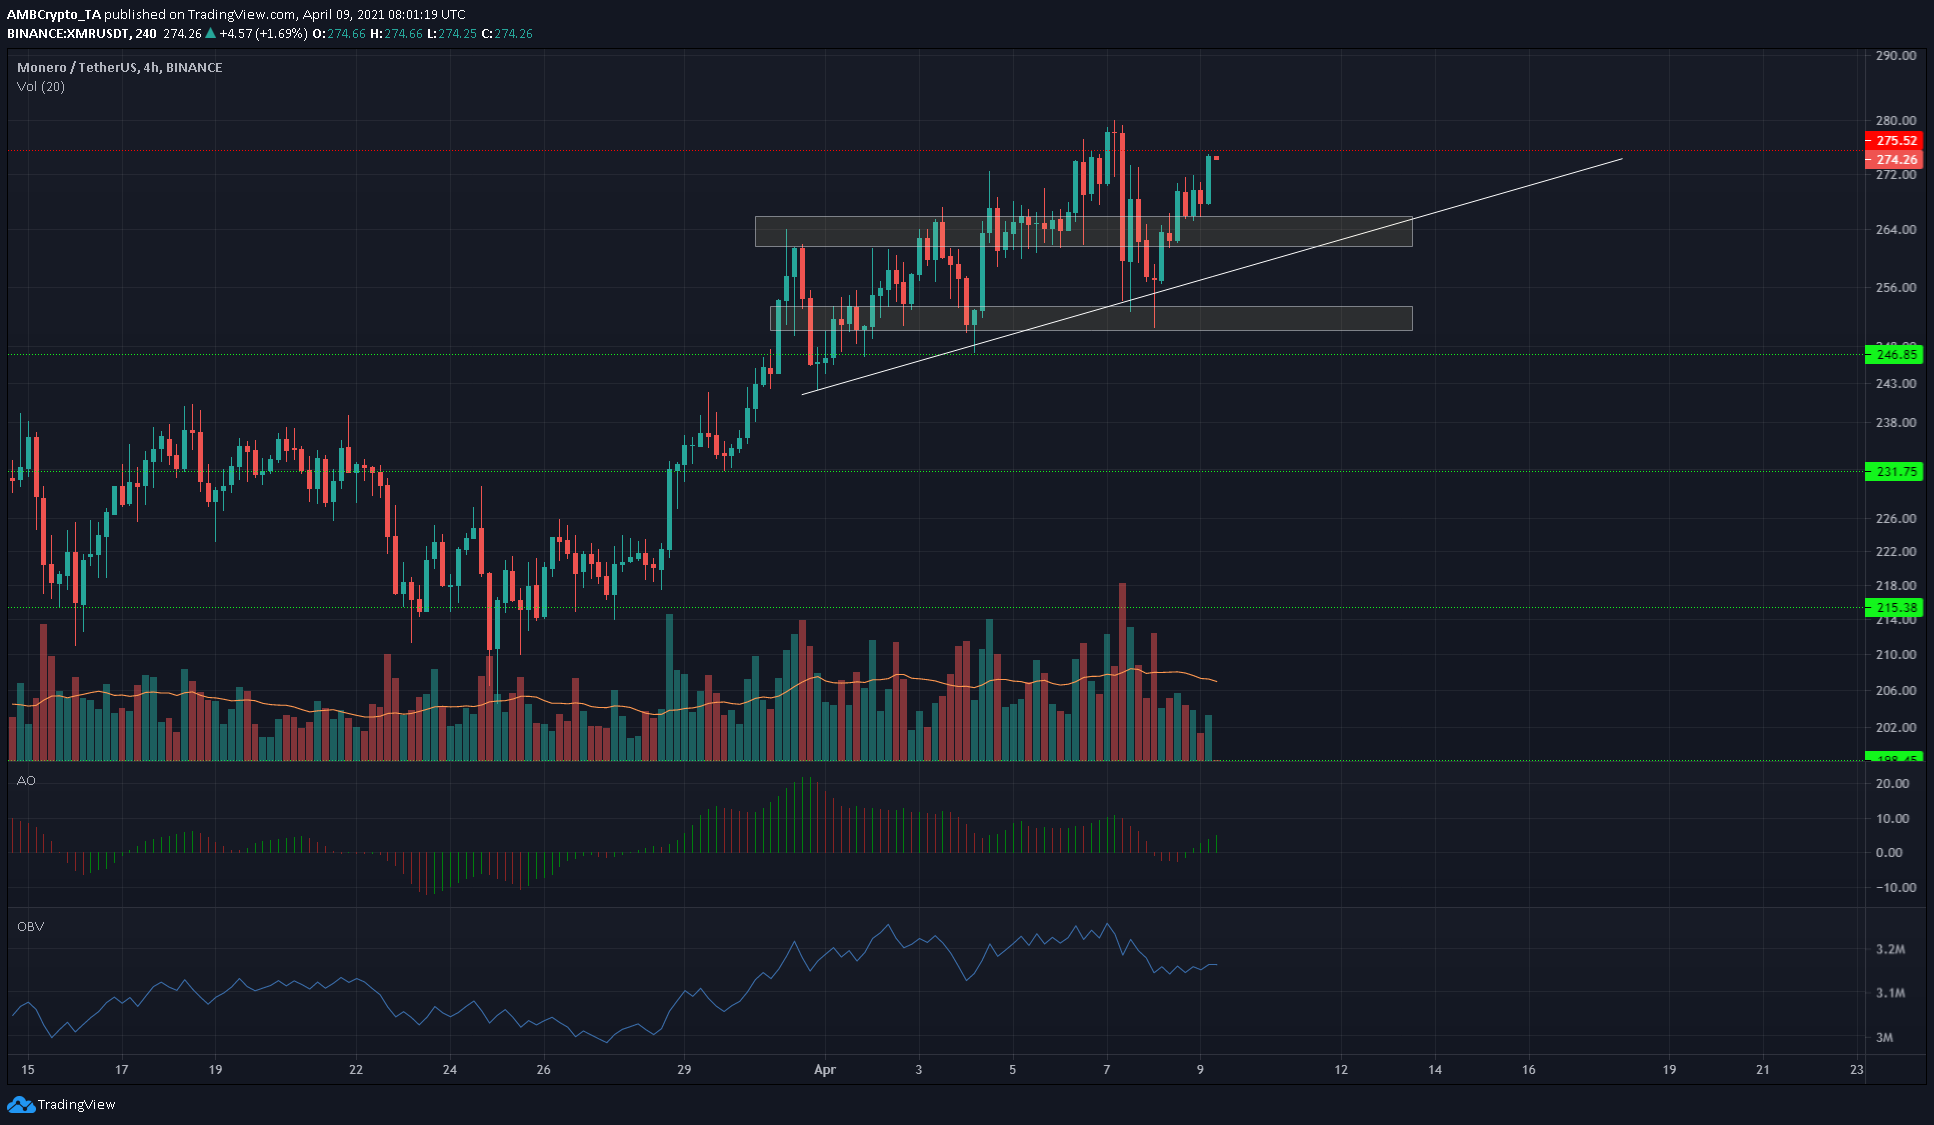
Source: XMR/USDT on TradingView
The $250 and $265 regions served as notable areas of supply and demand in the past week. The $265 area also appears to be flipped to an area of demand. The ascending trendline (white) shows the possibility of XMR forming an ascending triangle, with resistance at $275-$277.
The OBV has seen good buying volume from late March, but the past few days have seen some equilibrium in the buying and selling volume. In the case of rejection for XMR at $275-$280, it could visit $265 and see more buyers step in.
At the time of writing, the Awesome Oscillator was moving above the zero line to show bullish momentum.
Chiliz [CHZ]
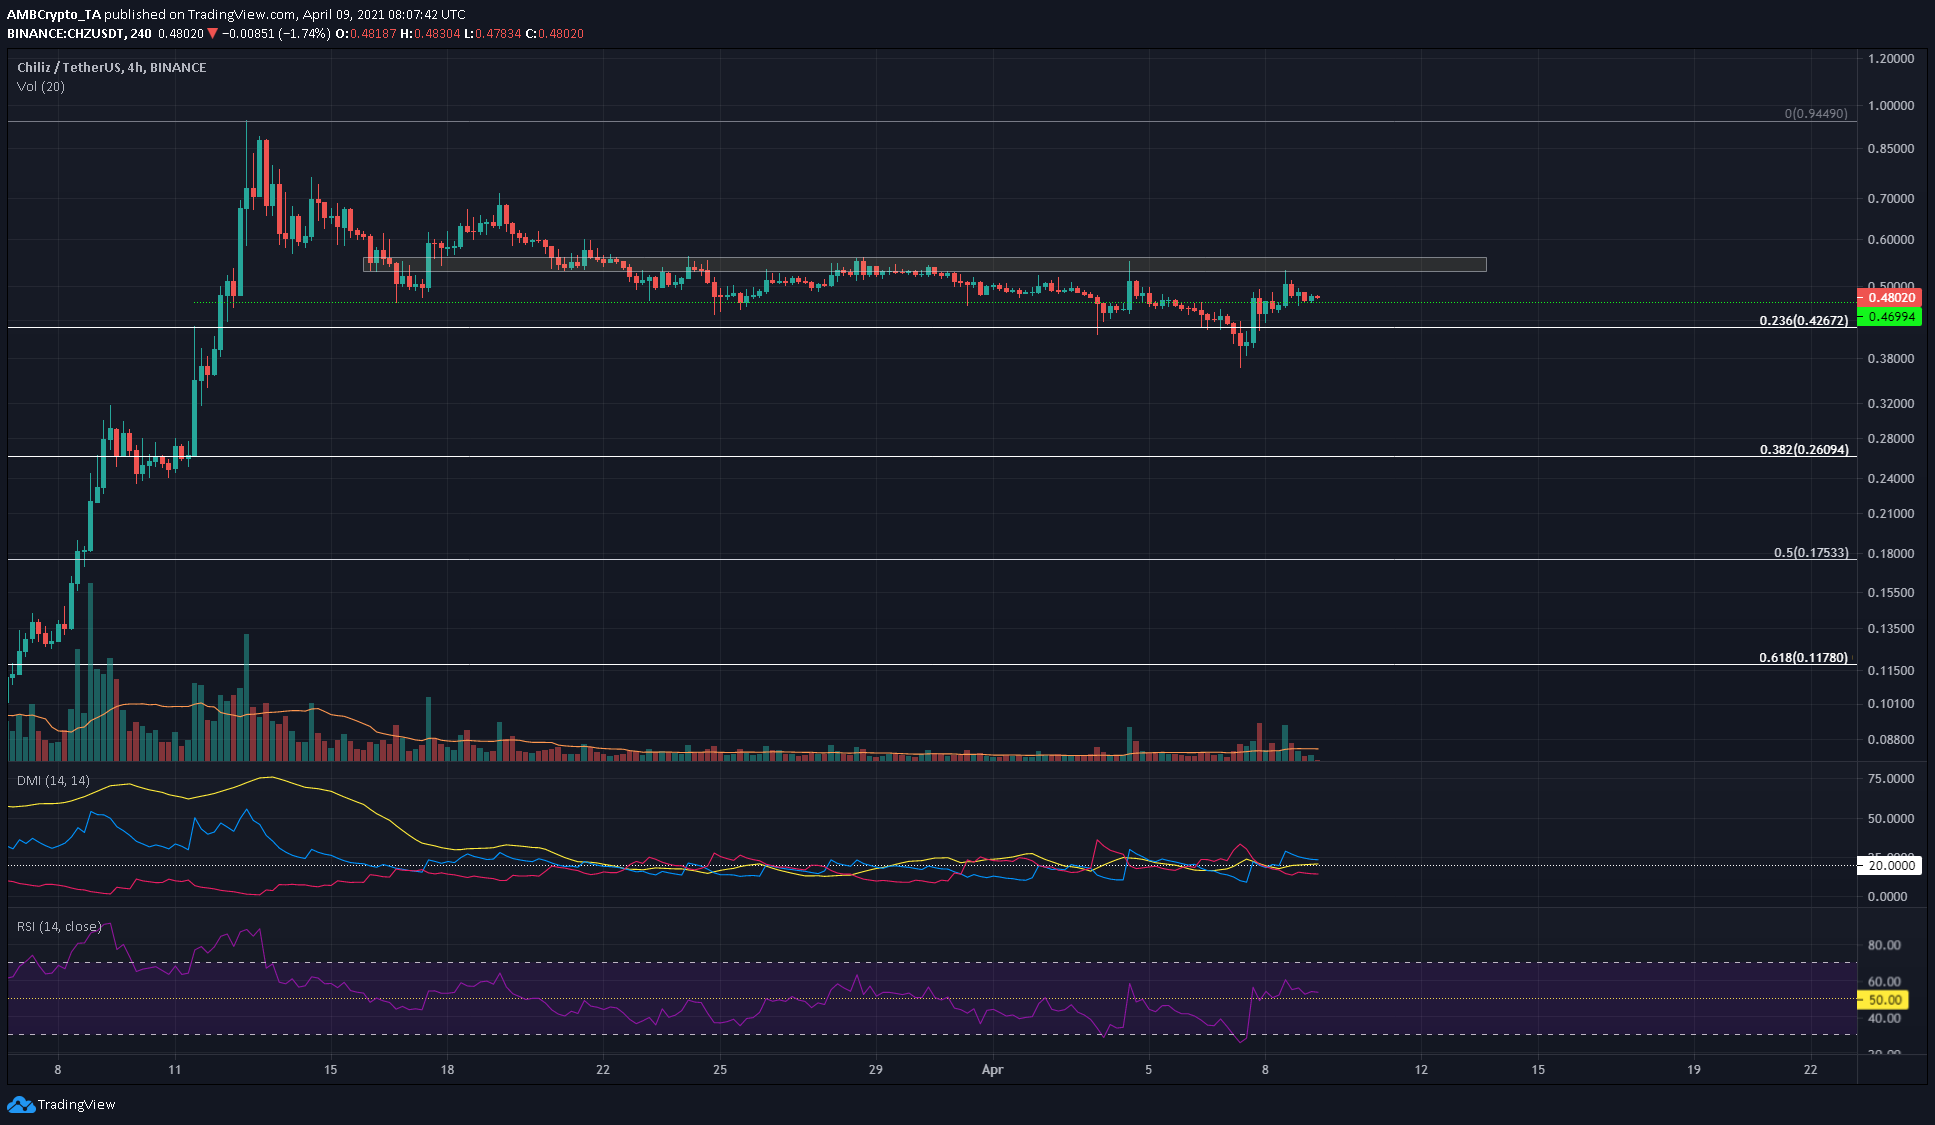
Source: CHZ/USDT on TradingView
For most of the past month, CHZ has been trending lower on the charts. The area of supply at $0.53-$0.56 remained unbreached, and CHZ dropped beneath the $0.42 and $0.47 support levels, but climbed back above in the past few days.
The Directional Movement Index showed a lack of definite direction for CHZ, since the ADX (yellow) and the directional indicator lines were all hovering about the 20 value. The RSI, which dropped to 26 when CHZ visited the $0.38 mark, has recovered to show a neutral 52 at the time of writing.