Litecoin Price Analysis: 24 January

Disclaimer: The findings of the following analysis is the sole opinion of the writer and should not be taken as investment advice
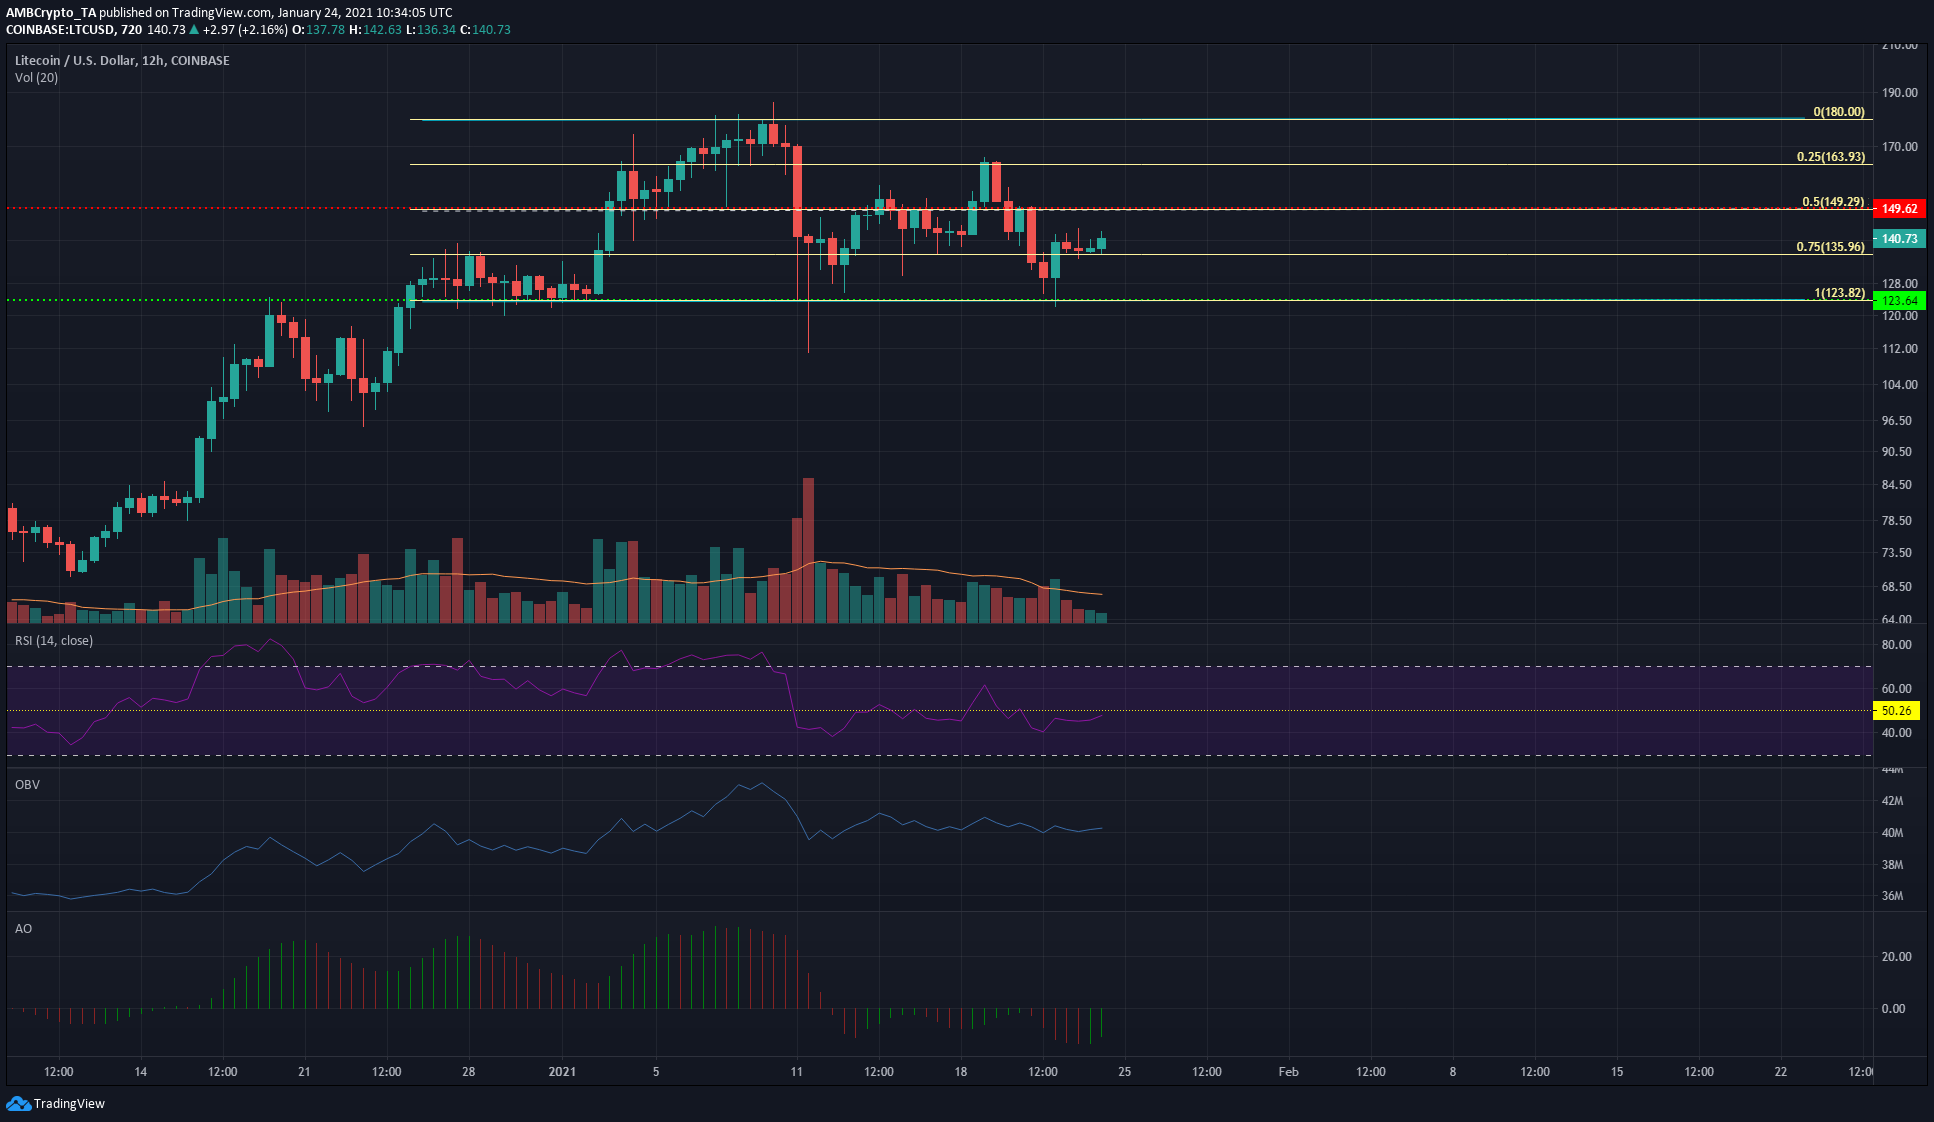
Litecoin has traded within a range since late December and approached the mid-point of the range. Technical indicators showed that the momentum has not quite flipped bullish for LTC, meaning that the reaction of the price at the $149 level will be of paramount importance.
Litecoin 12-hour chart

Source: LTC/USD on TradingView
The range between $123 and $180 was split using Gann’s rule of eighths to give the levels of importance within the range, with the 50% level at $149 being the most important. Over the next few days, a rejection at this level will see LTC revisit $135, and possibly drop as low as $123. Climbing above the 50% level, like it did a few days back, will see Litecoin touch the $163 level of resistance.
The RSI was at neutral 50, showing a lack of momentum toward either direction. The OBV was quite flat over the past week, denoting equilibrium between buying and selling volumes. This has to change for a strong move for LTC to materialize.
The coin’s trading volume was also low. A move towards above-average trading volume will show market conviction and can be used to enter a position in the direction of the move.
The Awesome Oscillator was unable to go above the zero line, even though it formed a bullish twin peak formation on the 18th of Jan, followed by LTC surging by nearly 15% from $140 to $163. A similar bullish twin peak set up will give a buy signal.
Conclusion
At the time of writing, neither buy nor sell signals were given by Litecoin. However, some factors such as trading volume or the price reaction at $149 can give a trader the signal to enter the market in an appropriate direction. The 25% and 75% levels are take-profit levels, and based on the momentum of LTC the range lows and highs can also be tested.


