Litecoin Price Analysis: 29 January

Disclaimer: The findings of the following analysis are the sole opinions of the writer and should not be taken as investment advice
Litecoin’s price was forming lower highs on the charts, suggesting the end of an uptrend in the medium-to-long term. However, in this lower high set up, the price formed a bullish pattern. A bounce/close above a critical level would point to a 10% to 20% surge on the horizon for the cryptocurrency.
Litecoin 4-hour chart
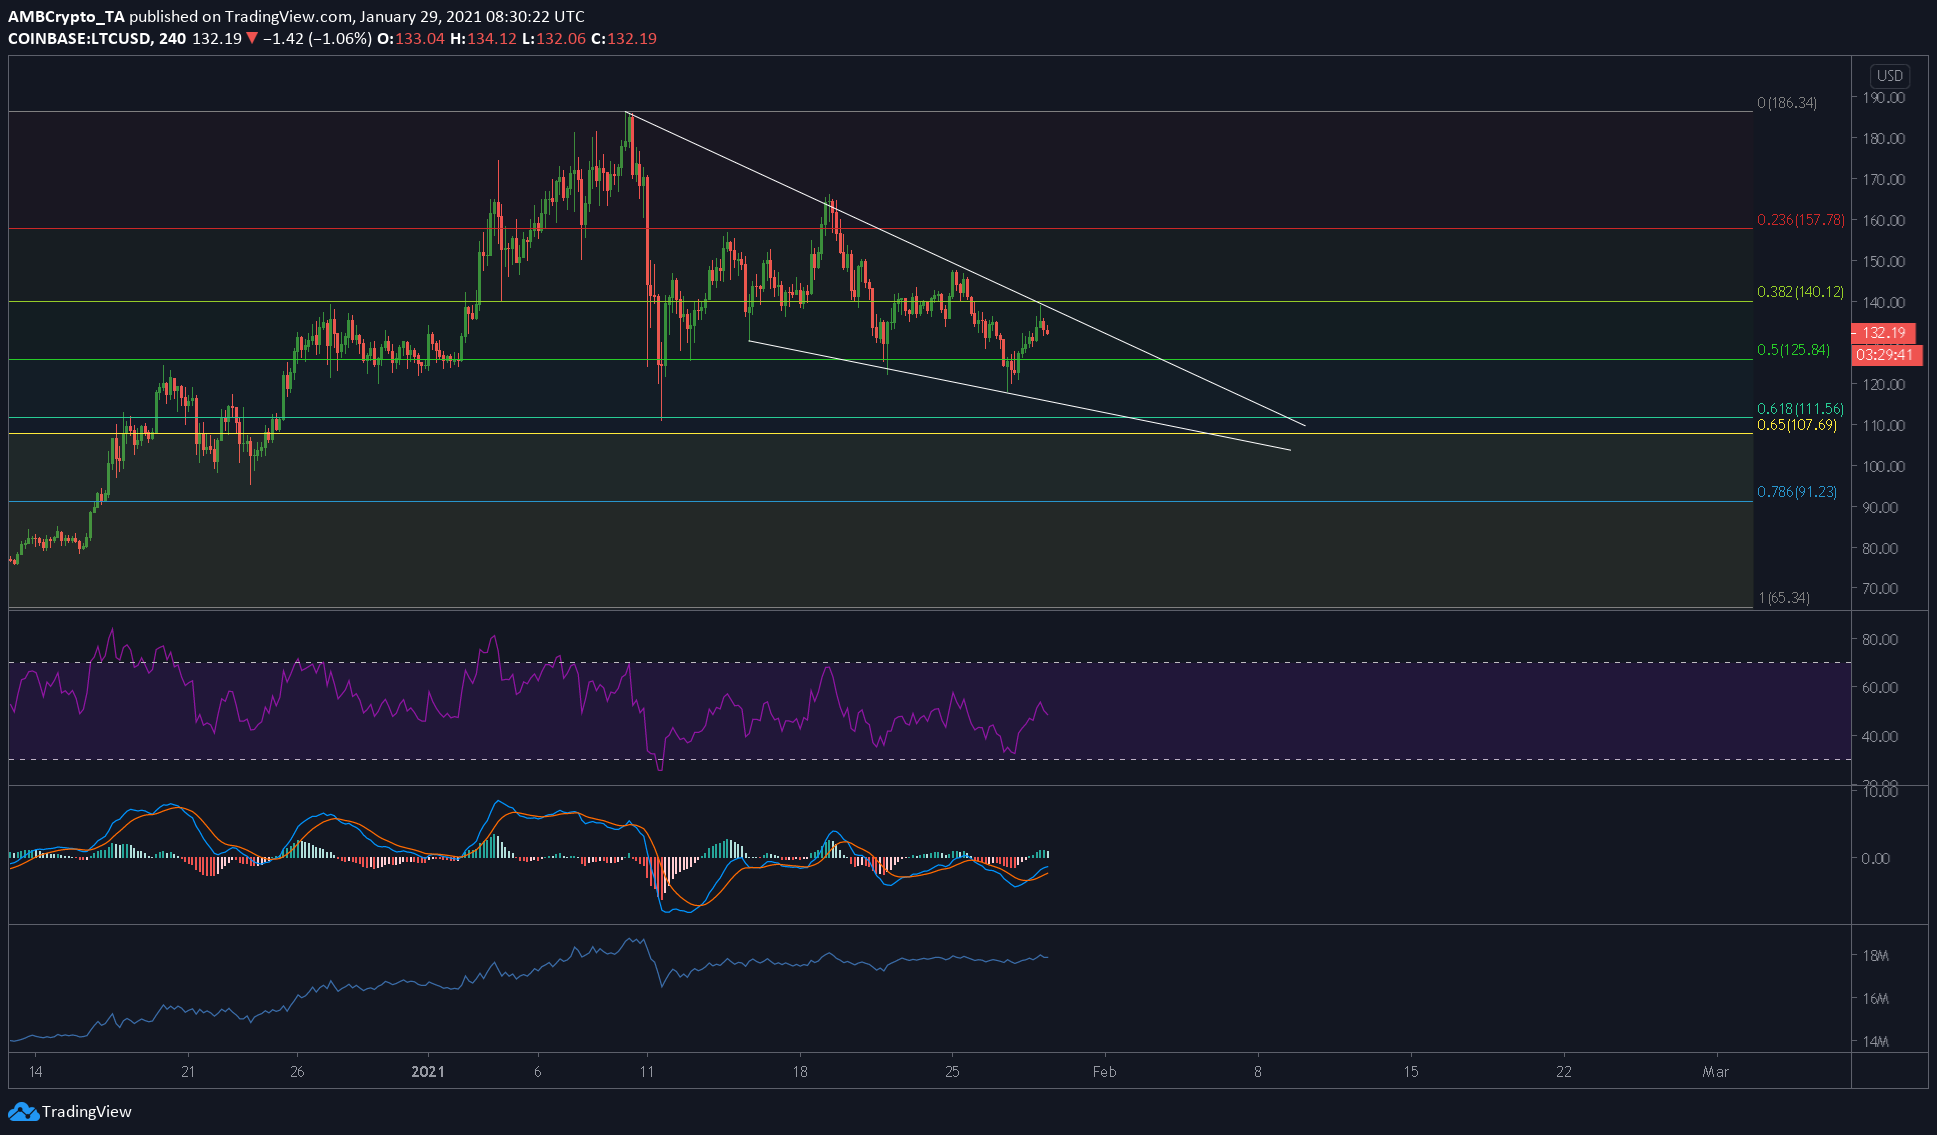
After hitting a local high at $186, Litecoin was trading at $146 at press time, while stuck in a bullish wedge pattern. The price had already been rejected at the upper trendline of the wedge and it was heading towards its critical support at $125.84, a level that coincided with the 0.5-Fibonacci level.
A bounce from this level and a subsequent close above the upper trendline of the channel would point to a bullish breakout. However, a failure to do so and a close below the 0.5-Fibonacci level would indicate the continuation of the sell-off.
The RSI indicator underlined lower highs and pointed to a decrease in buying momentum. The MACD indicator projected a short-term bullish outlook for LTC, while supporting the same was the OBV indicator, with the latter noting a constant increase in volume.
The sell-off at this level wasn’t done yet, at press time, hence more southbound movement for LTC can be expected in the near-term. However, in the medium-term, Litecoin continued to seem bullish due to the falling wedge pattern.
Litecoin 1-day chart
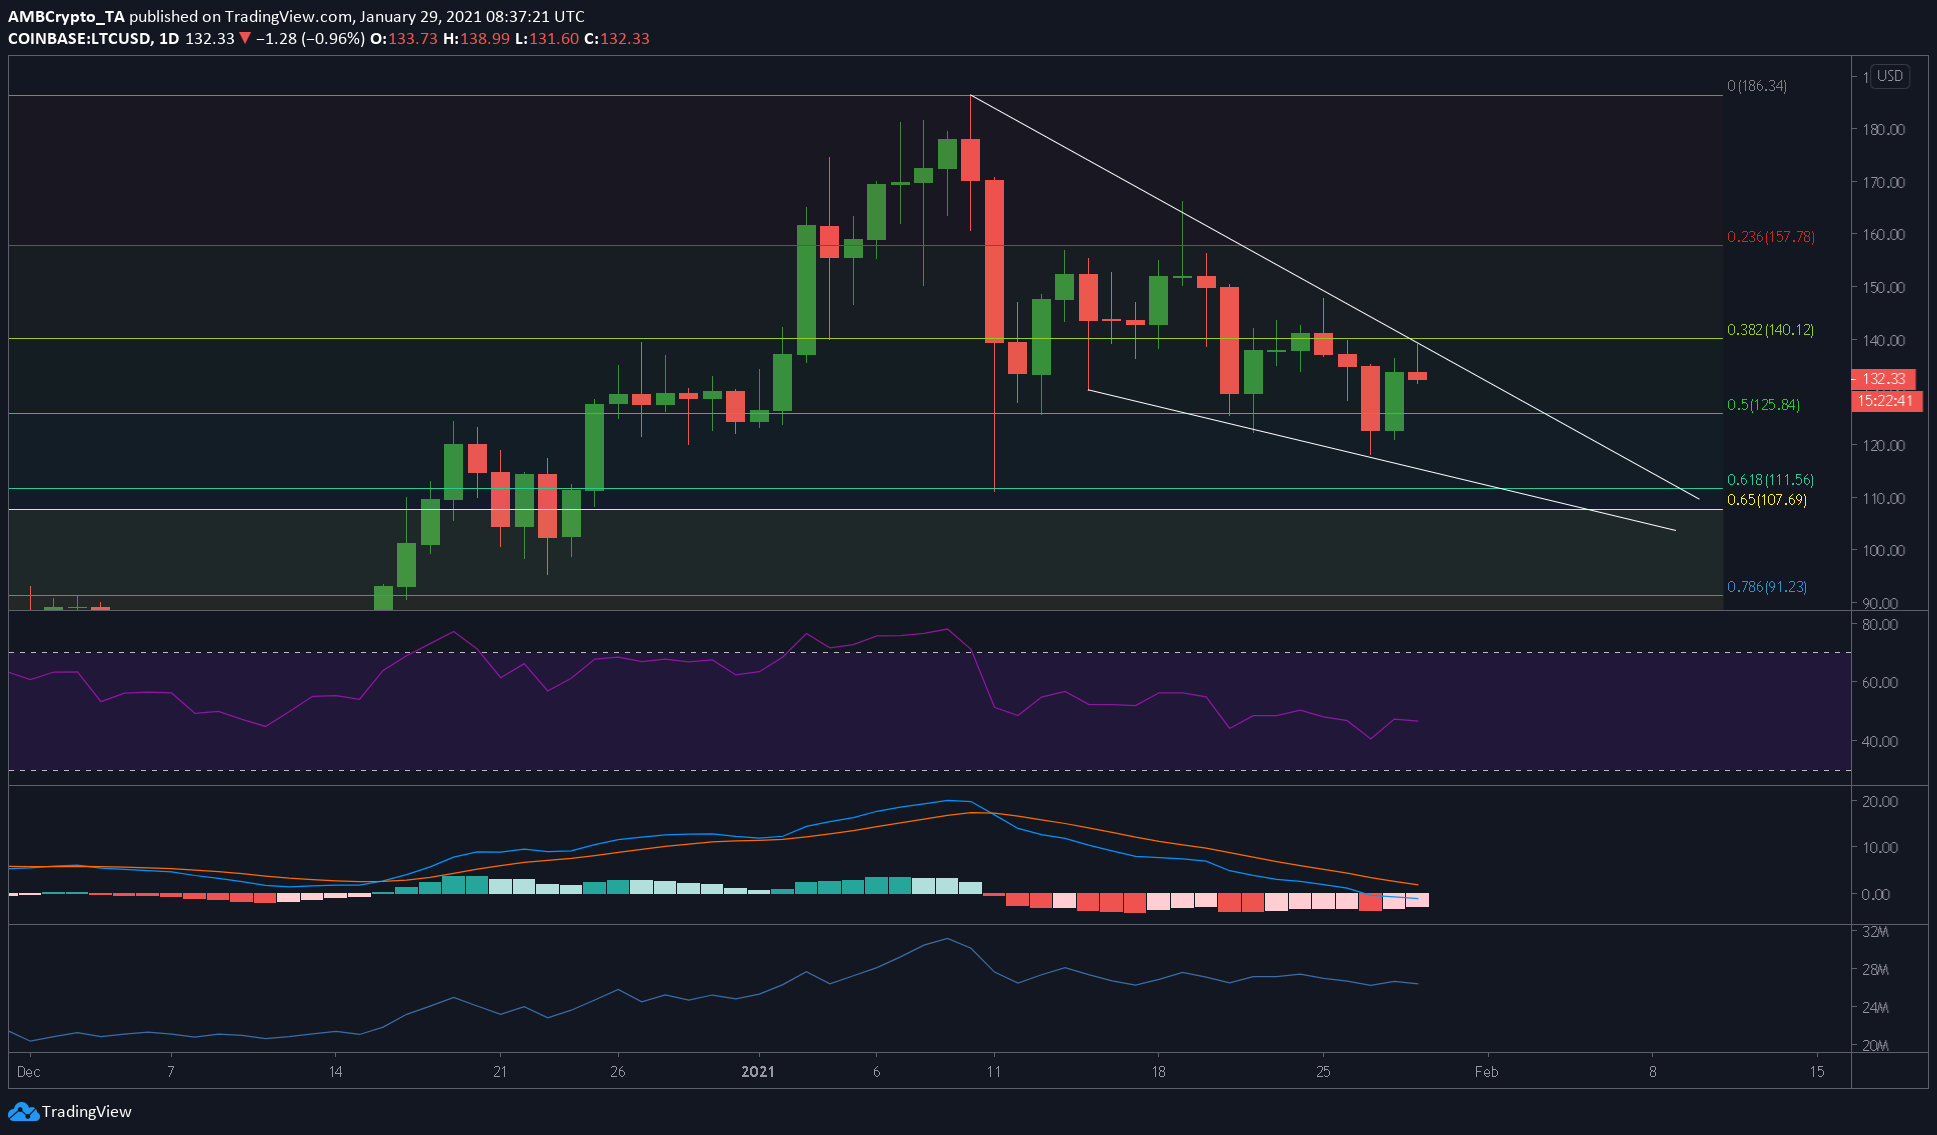
The 1-day chart showed that the drop resulting from the rejection at the upper trendline of the falling wedge may exceed the 0.5-Fibonacci level at $125.84. The next immediate support was above the golden pocket at $118.63.
Hence, a drop up to this level [ie., 11.34% ] can be expected from where Litecoin was trading, at press time. To be conservative, a close below the 0.618-Fibonacci level at $111 or even $107 would spell disaster for the cryptocurrency.
Conclusion
Litecoin’s prospects in the near-term seemed bearish due to the rejection at a critical resistance level. However, the coin showed promise on both the 1-day and the 4-hour timeframes. A close above the upper trendline could push LTC to $140 following a minimum surge and $157 if the buyers step up their game.

![Rising bond yields put Bitcoin [BTC] at risk — a Fed rate hike could be next](https://ambcrypto.com/wp-content/uploads/2026/08/IMG_4752-e1785656382502.webp)