Litecoin, Shiba Inu, EOS Price Analysis: 13 November

After the correction phase seemed to ease, most altcoins started to show revival signs by being in the green zone in the last 24 hours. However, Litecoin and Shina Inu continued their withdrawal after their near-term technicals confirmed the bearish force.
On the other hand, EOS flashed mixed signs while noting a 9.6% decline over the past three days.
Litecoin (LTC)
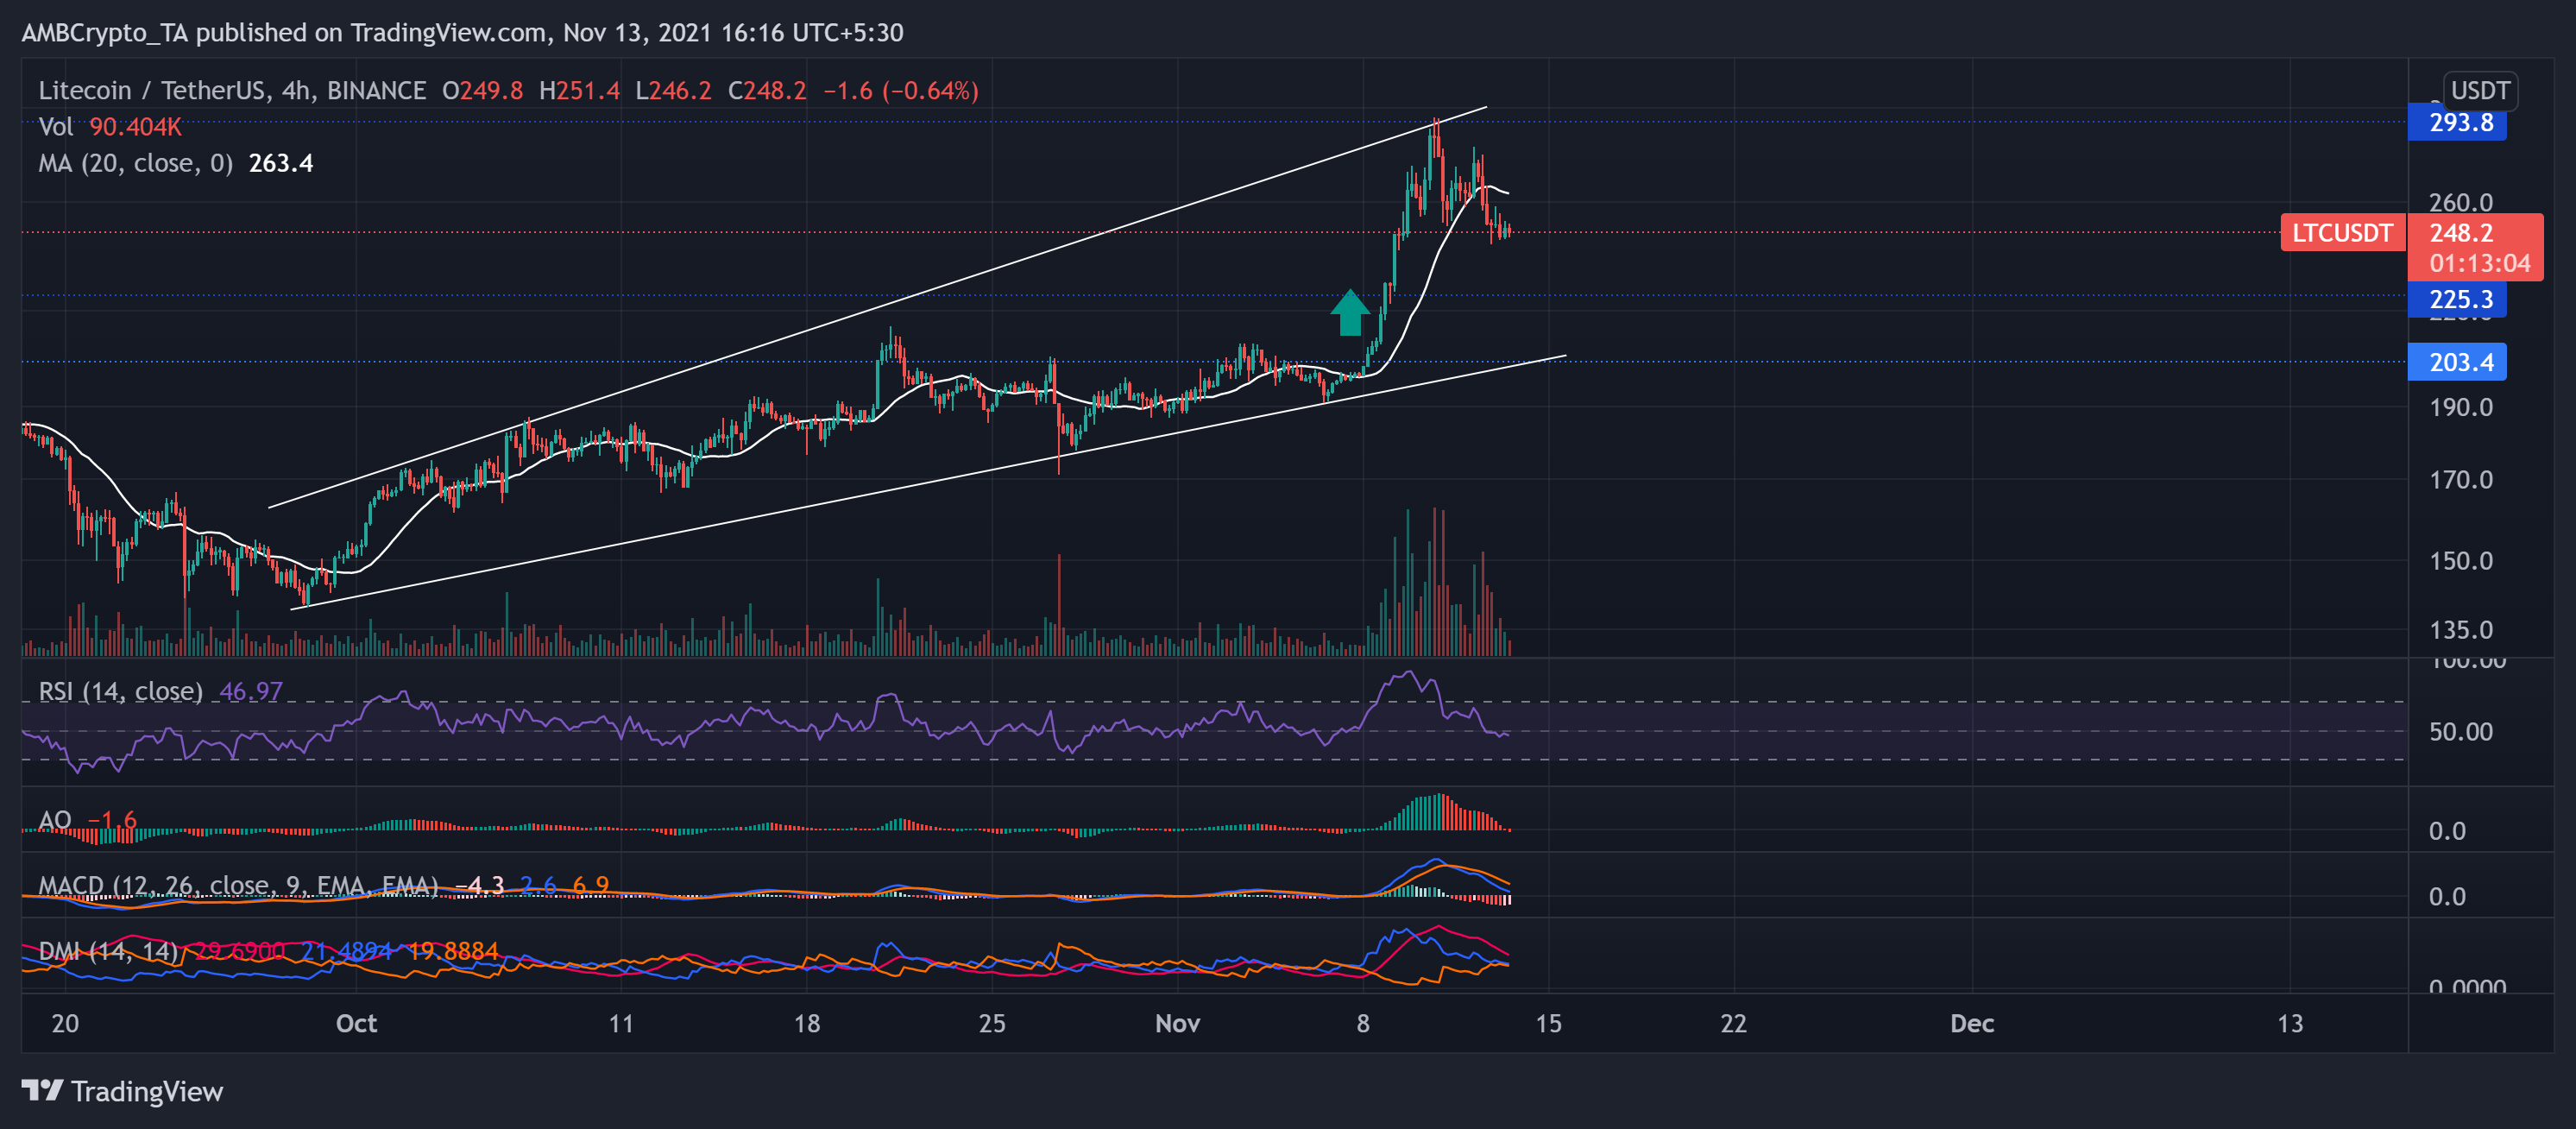
Over the past 45 days, LTC persistently rose by swaying between the ascending lines. This momentum led to the fruition of a 74.5% ROI over the past seven weeks for the alt.
The buyers visibly gained momentum over the past week as they breached the $225-mark (support level). Further, while Bitcoin surged to its ATH on 10 November, LTC found its 25-week high on the same day at $295.7.
However, since then, the price action retraced by registering a 17% three-day blip. At press time, LTC traded below its 20-SMA (white) at $248.2. The technicals fancied the sellers but did not tarnish the possibility of a near-term bullish revival.
The RSI was southbound after it saw a downfall of 19 points over the last day, undeniably preferring the bears. Further, the AO and MACD confirmed RSI’s conclusion. Nevertheless, the +DI was slightly above the -DI while MACD histogram flashed shorter light red bars. This reading bought forth the near-term possibility of a bull revival if they re-demonstrate their power.
Shiba Inu (SHIB)
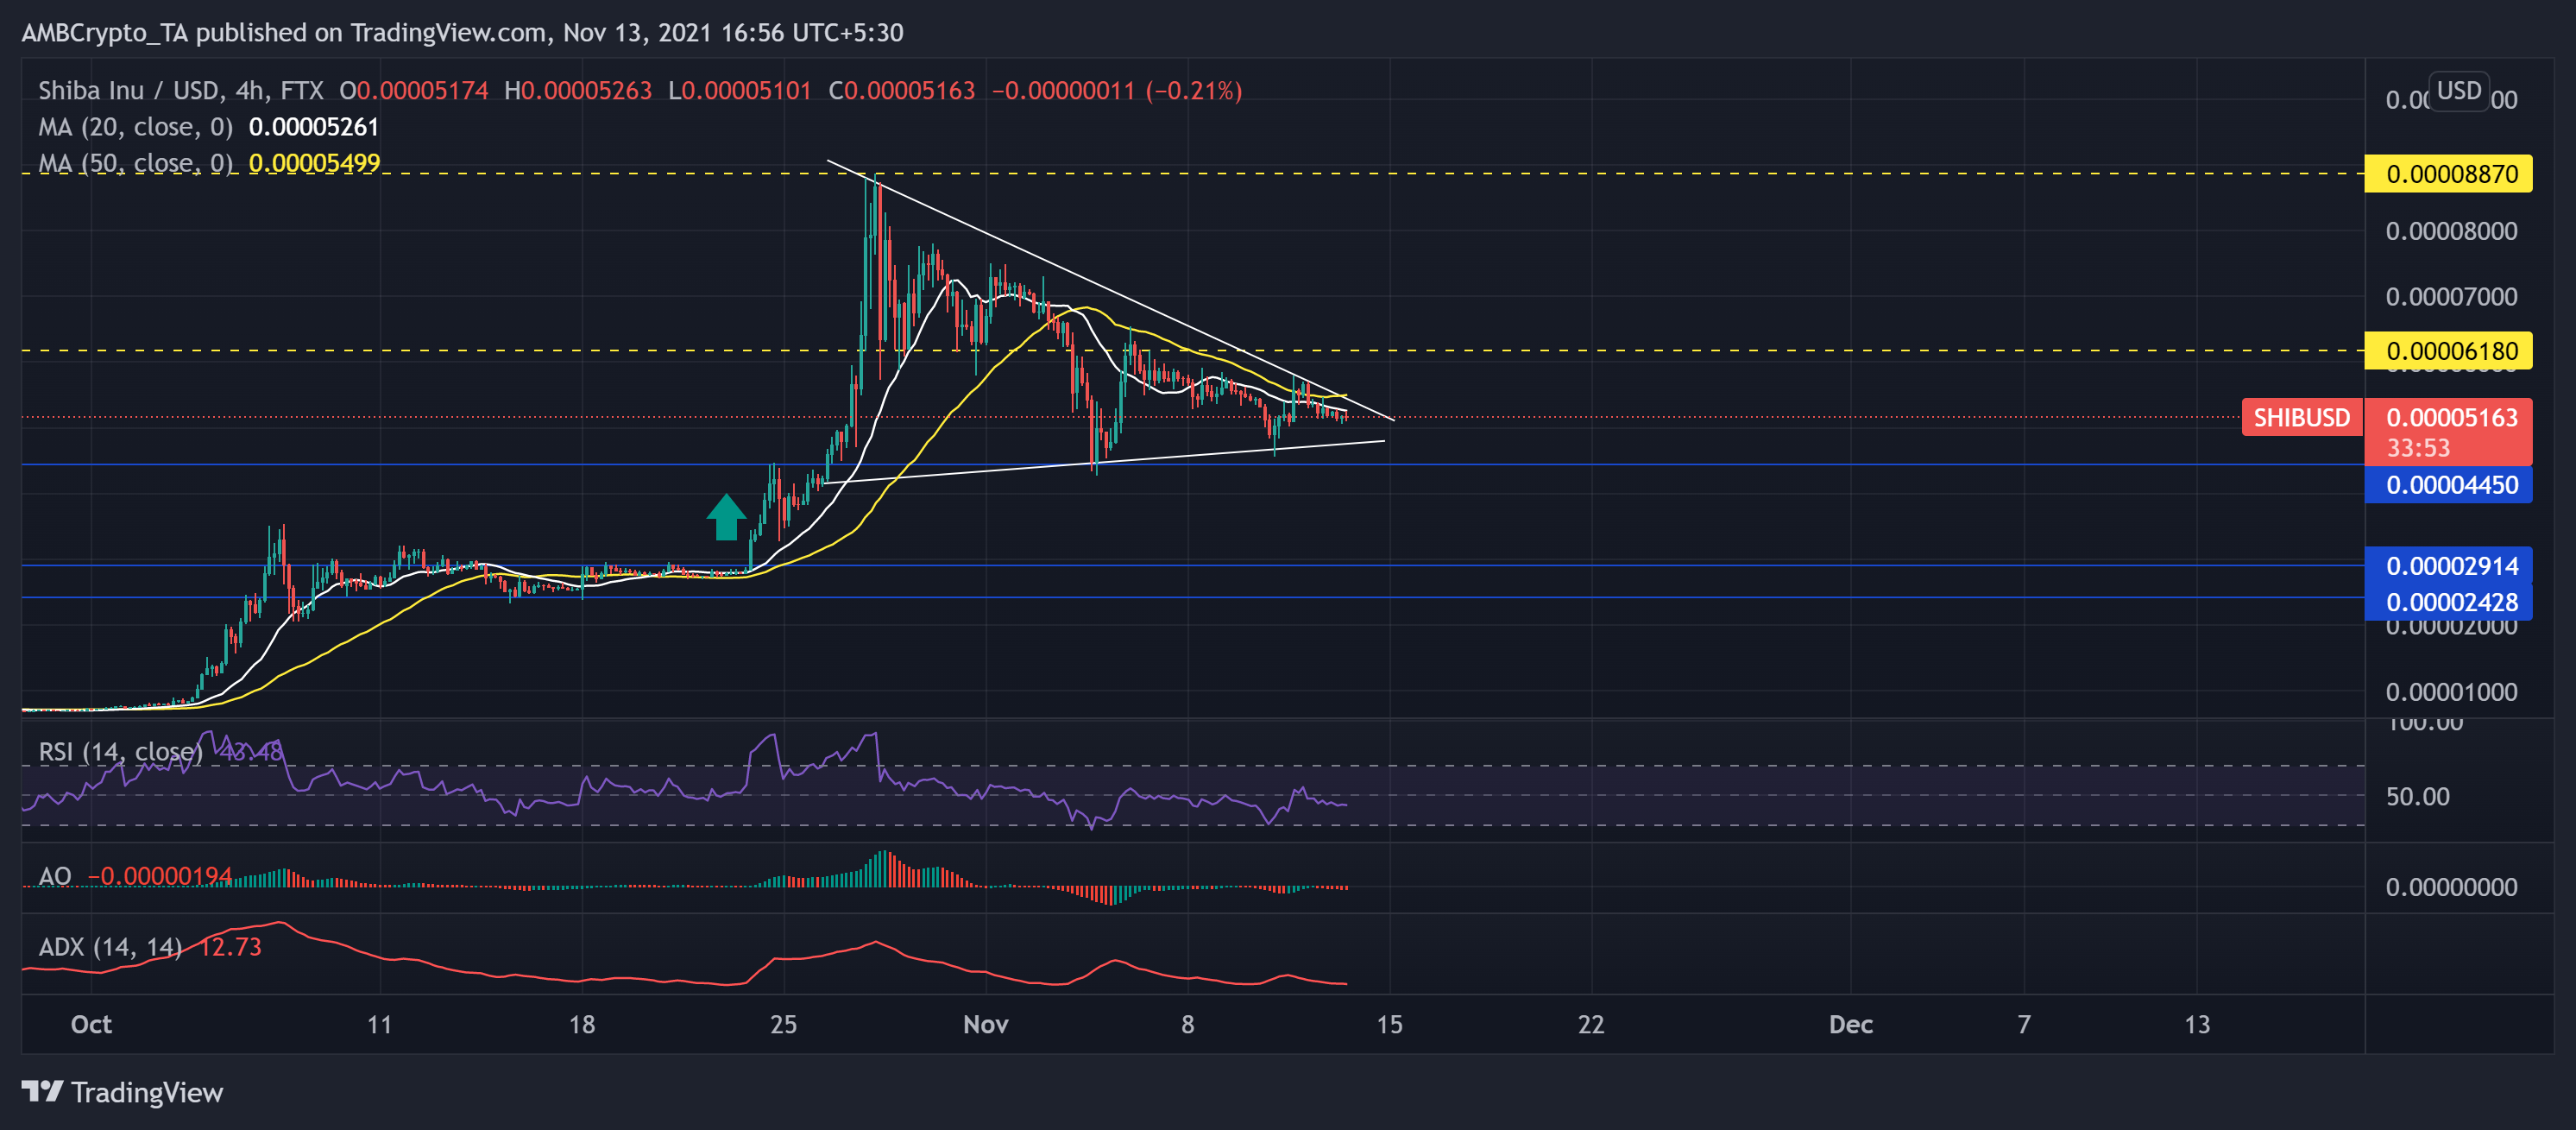
The meme coin was northbound after it undertook an instant uptrend from 23 October. SHIB surged by over 200% over the next five days to reach its ATH on 28 October. After which, the price retreated in a descending triangle in the withdrawal phase.
Accordingly, SHIB registered a nearly 39% downfall over the last 16 days after dipping below its immediate resistance at $0.00006180. However, the token was still in the green zone on its monthly charts and traded at $0.00005163 at press time.
Over the past 13 days, the bulls failed to keep the RSI above the midline as it wavered below the 50-mark. Additionally, the trading price was below the 20-50 SMA, clearly depicting a bearish vigor. Besides, the AO reaffirmed the previous conclusions. However, the ADX displayed a weak directional trend.
EOS
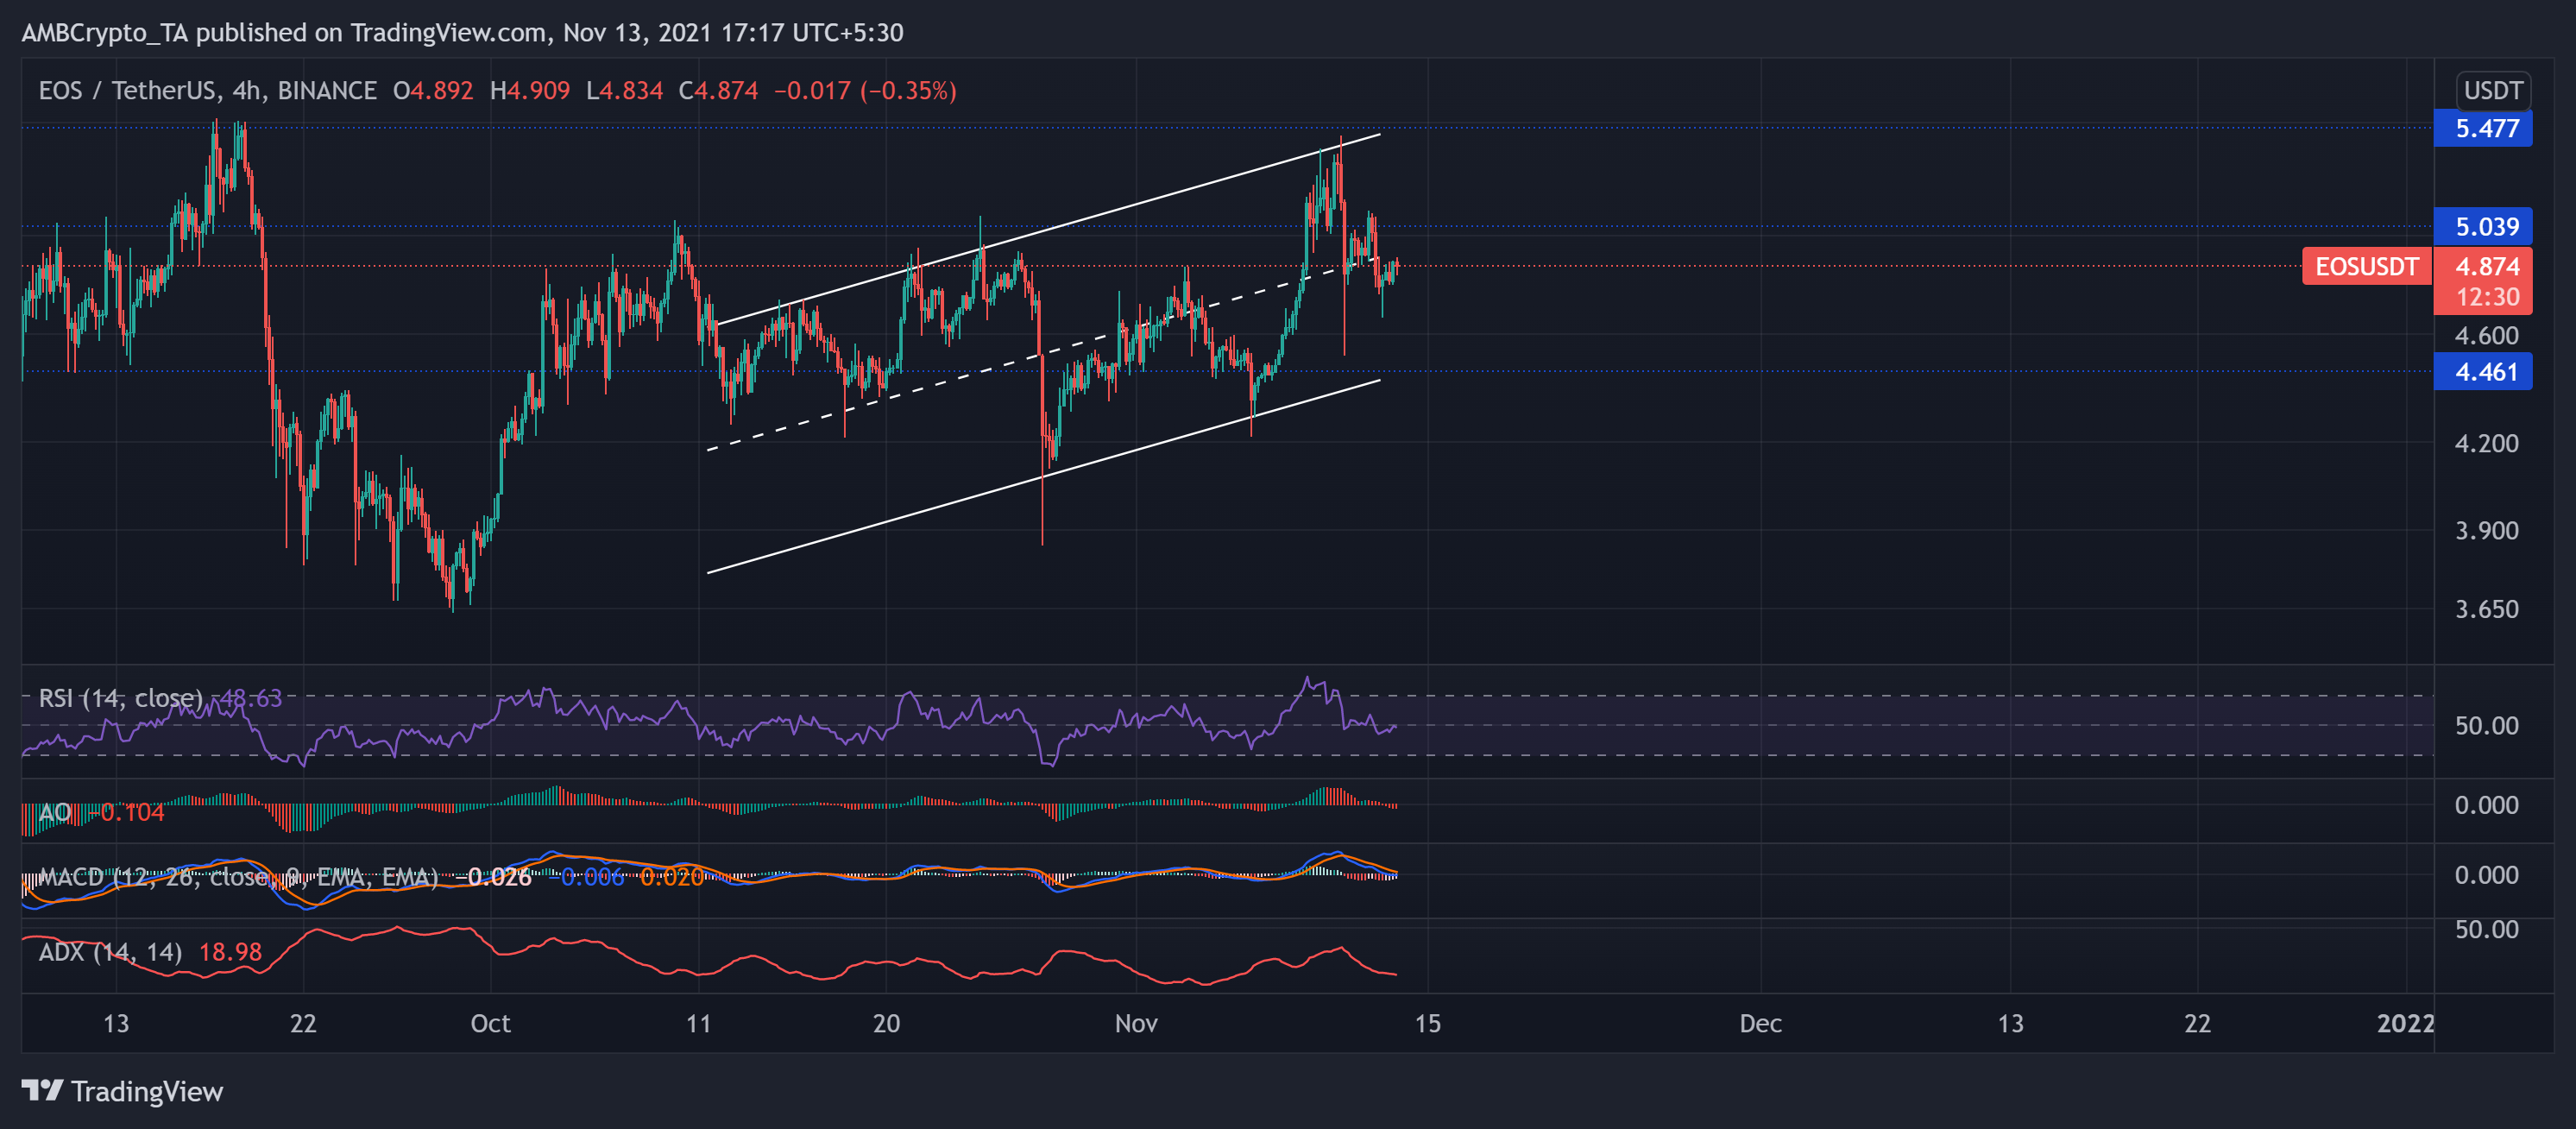
Since 11 October, the EOS price action undertook a bullish trajectory as the price moved between the two parallel lines heading north. The digital currency noted a 6.01% and 10.16% monthly and weekly ROI, respectively. Consequently, EOS reached its seven-week high on 10 November and retreated between the parallel lines.
The altcoin saw a 9.6% withdrawal in three days while the technicals hinted at increasing selling strength in the near term. At press time, EOS traded at $4.874.
The RSI stood slightly below the half-line while pointing downwards. Furthermore, the AO flashed red signs. However, the ADX displayed a weak directional trend while the MACD histogram depicted possible bullish revival signs.


