Litecoin sinks below key area of support, but can it see a recovery at $110

Litecoin climbed from $143 to $282 in October and November, but has retraced all of those gains and then some more since mid-November. The $143 level was expected to see demand step in once again. It did, but the bounce was weak and the price fell beneath the $143 level once again after the selling pressure on Bitcoin forced it to drop below $45.8k. The next area where Litecoin could see a bullish reaction was at $110.
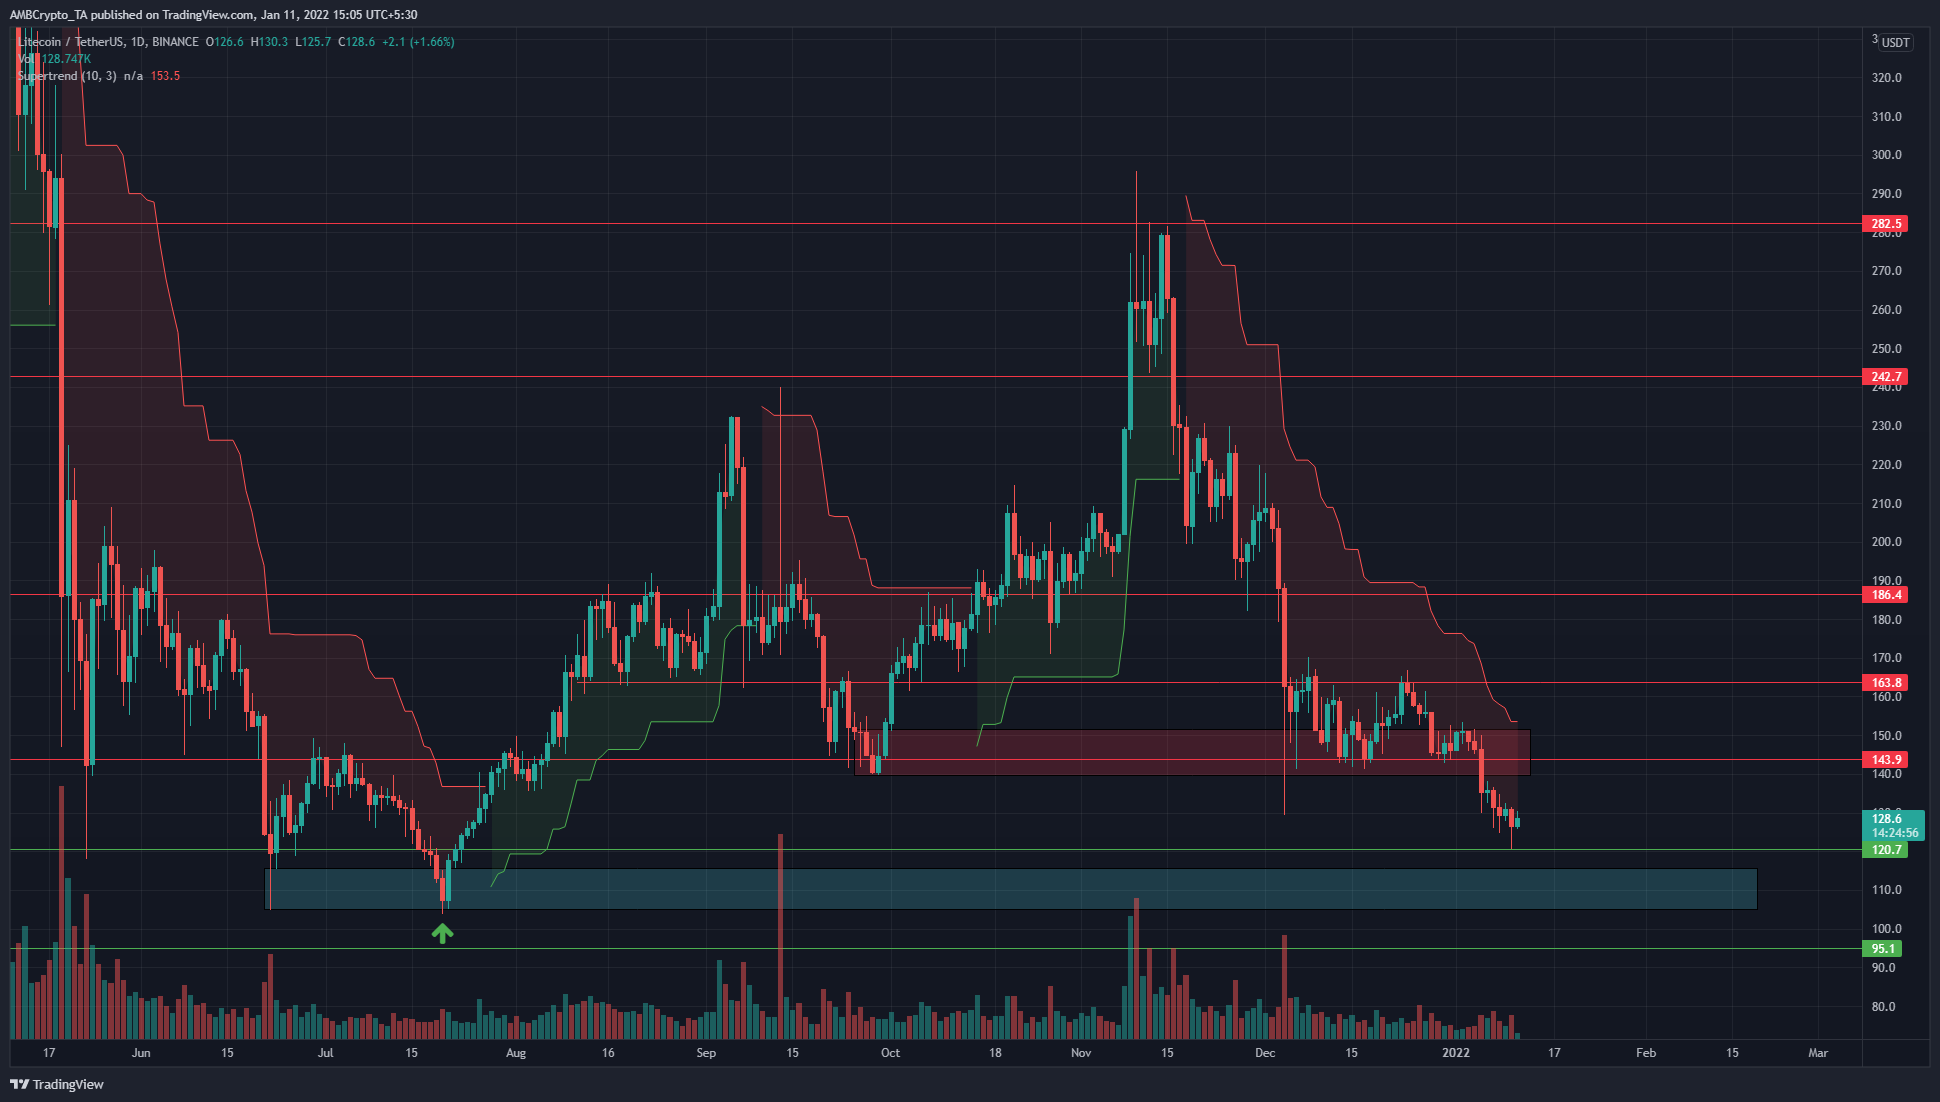
In late July (green arrow), on the daily chart, the price gravitated back to the candlewick it had posted a month earlier. The price was searching for liquidity, and the $110 area saw buyers step in with strength. Subsequently, LTC saw an impulse move in the opposite direction and climbed as high as $230 as it overcame significant levels of resistance on the way.
The $143 area also saw a similar impulse move upward in September, but Litecoin could once see a weak bounce off this area (red box) in December before the zone gave way in the face of sellers.
At the time of writing, the $110 area (cyan box) represented an area where Litecoin buyers were likely to set their bids. The question remained whether Litecoin would see an impulse move upward once more, or whether it would be more of a bounce back to $143 before another slump in LTC prices.
Rationale

The RSI was near the 30 mark to show strong bearish momentum. It has been beneath the neutral 50 for a few weeks now, which showed a bearish trend was in progress. Similarly, the Awesome Oscillator also printed red bars in recent days to show bearish momentum was climbing.
The On Balance Volume indicator was also in a downtrend which showed that selling volume has been greater than buying volume since November, reflecting the selling pressure on the price charts. The Supertrend also gave a sell signal.
Conclusion
If Litecoin can see a bullish engulfing candle on the daily chart as a reaction from $110, it would present a buying opportunity targeting $143. However, even then, the trend would remain bearish unless the $140 area can be flipped from supply to demand.


