Litecoin, Stellar, NEAR Price Analysis: 24 January

While altering the broader sentiment is still only a wish for the bulls, the near-term technical indicators of Litecoin, Stellar and NEAR continued to flash a selling bias after touching their multi-month lows.
Stellar and NEAR bullishly diverged with its 4-hour RSI but they need higher volumes to sustain a rally.
Litecoin (LTC)
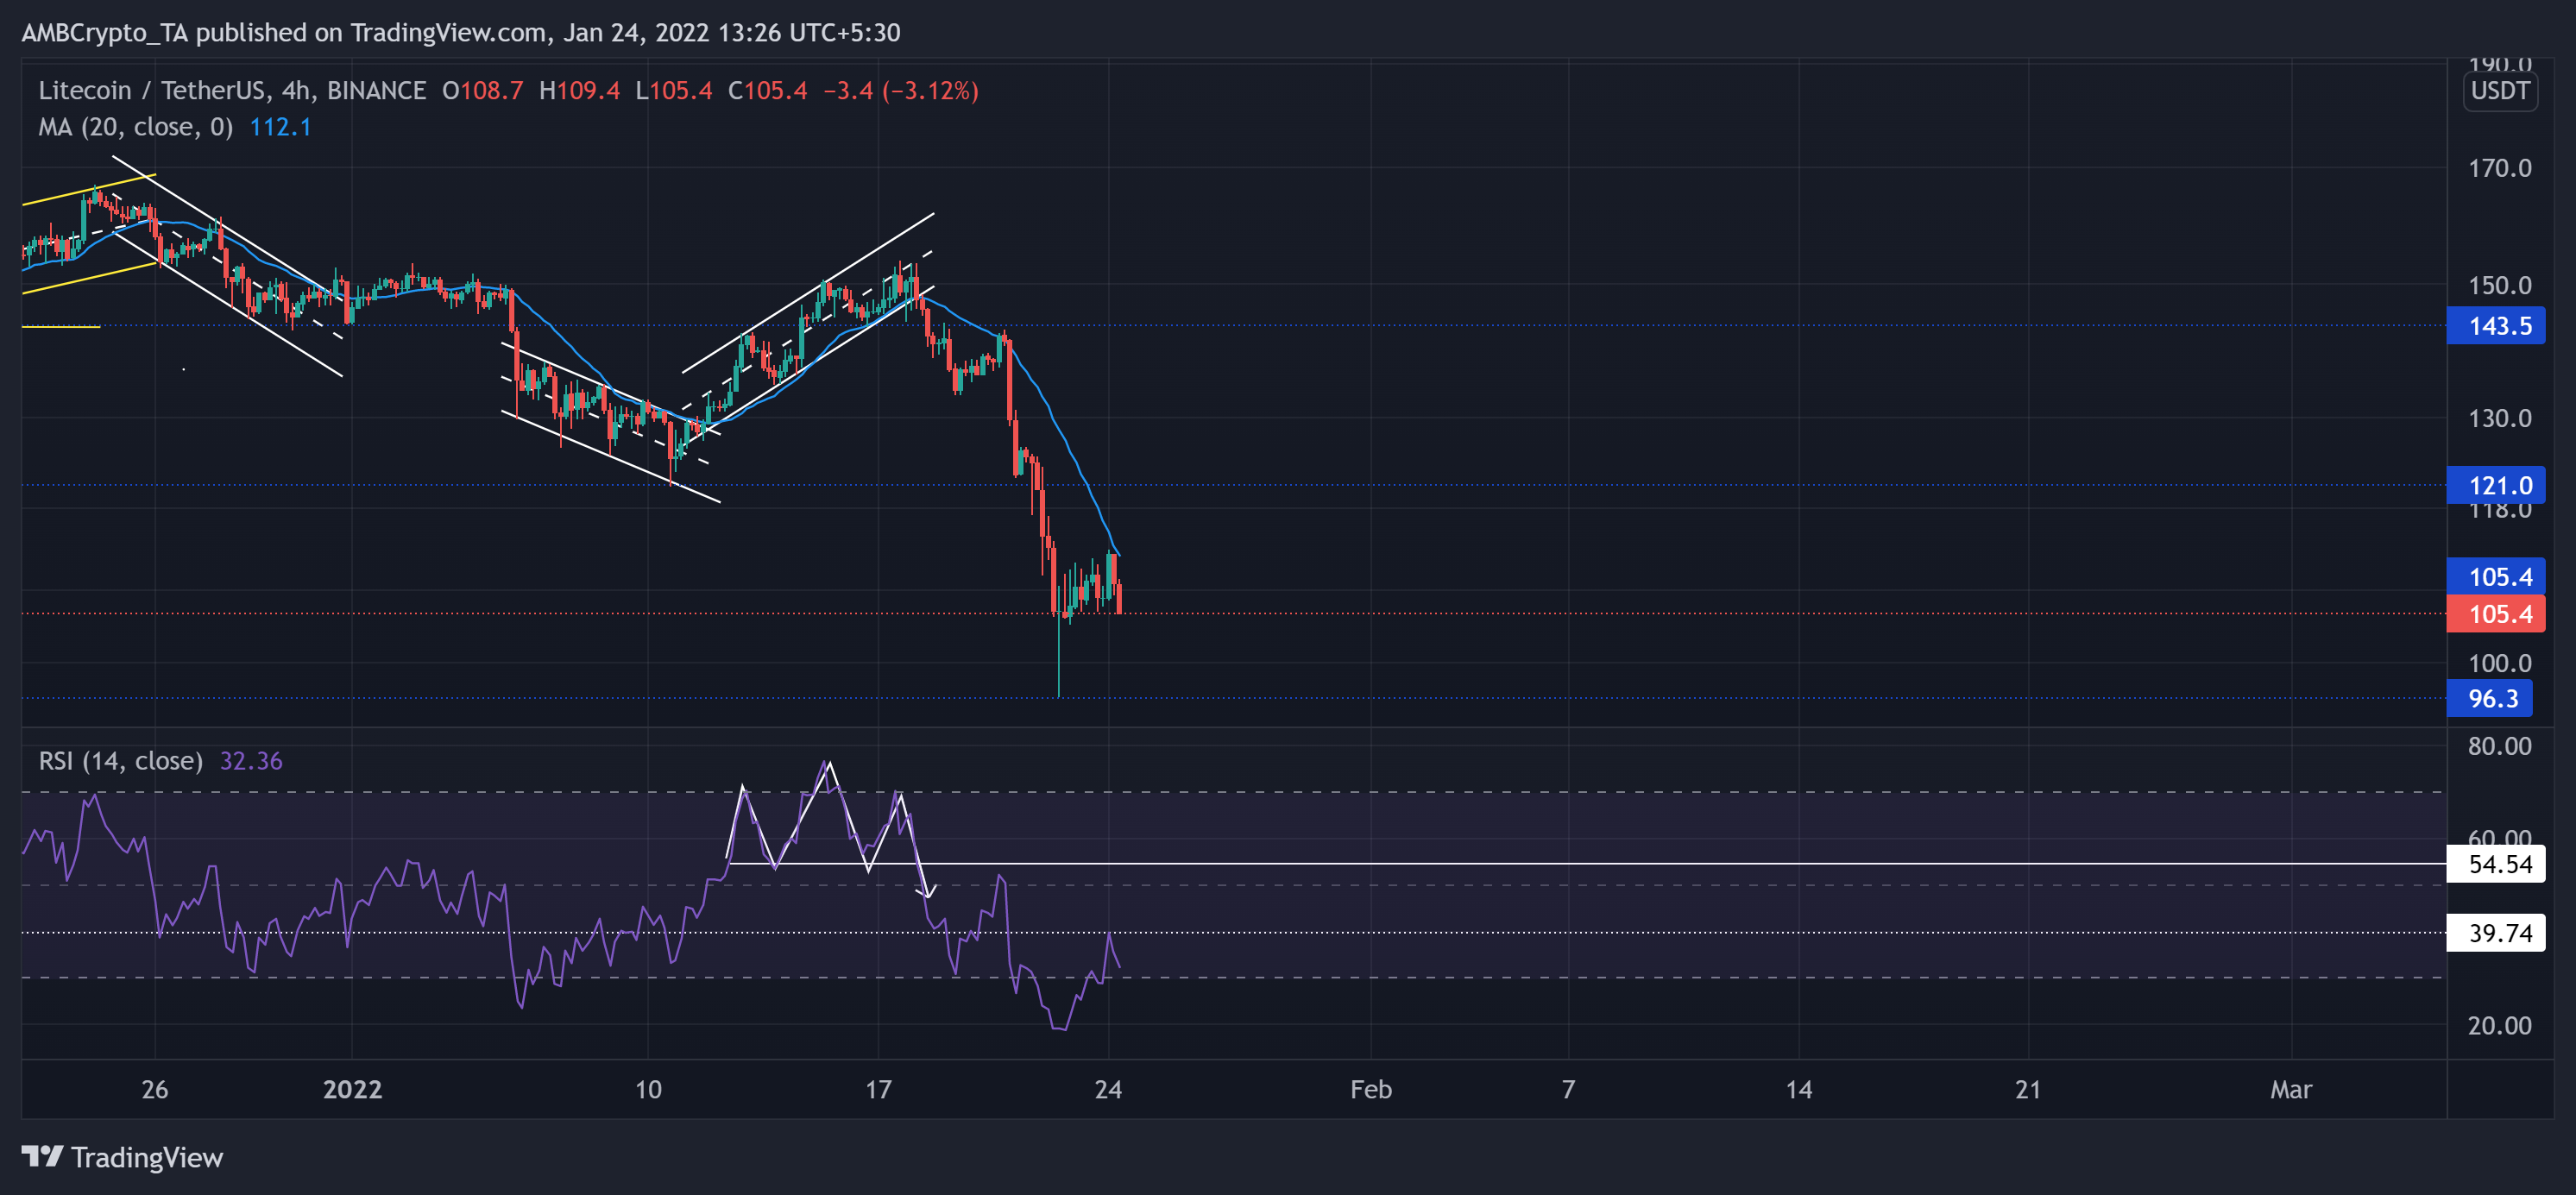
The sellers took on the initiative after the bulls lost the vital $143-resistance (previous support) on 5 January. LTC managed to claw back on an up-channel (white) but could not sustain itself above the aforestated mark.
Having an over 90% correlation with Bitcoin, LTC followed the king coin’s footsteps over the last week. As a result, the alt lost over 37% after the up-channel breakdown. Following the same, it poked its 13-month low on 22 January. Now, the 20-SMA (cyan) stands as an immediate barrier for the bulls. Also, buyers will have to defend the $105-level to prevent further breakdowns.
At press time, LTC traded at $105.4. Since the head and shoulder break down on 18 January, the RSI remained below the midline. To reignite the recovery chances, it needs to find a close above its immediate resistance at the 39-level.
Stellar (XLM)
Since the 5 January decline, XLM has practically oscillated below the basis line (green) of the Bollinger Bands. This movement depicted a strong bearish influence over the last three weeks.
The recent sell-off from the $0.2464-level propelled the alt to lose nearly a third of its value. Consequently, XLM hit its one-year low on 22 January. Subsequently, the recovery from there halted at the basis line yet again. Now, the $0.187-mark becomes vital for the buyers to hold.
At press time, XLM was trading at $0.1893. The RSI revived after a falling wedge breakout as it reclaimed the 33.8-mark. Over the past few hours, it bullishly diverged (yellow trendline) with the price action. Although the CMF was still below the zero-line, it pictured strong revival. However, the Volume Oscillator was at its record low, hinting at weak price movements.
Near protocol (NEAR)
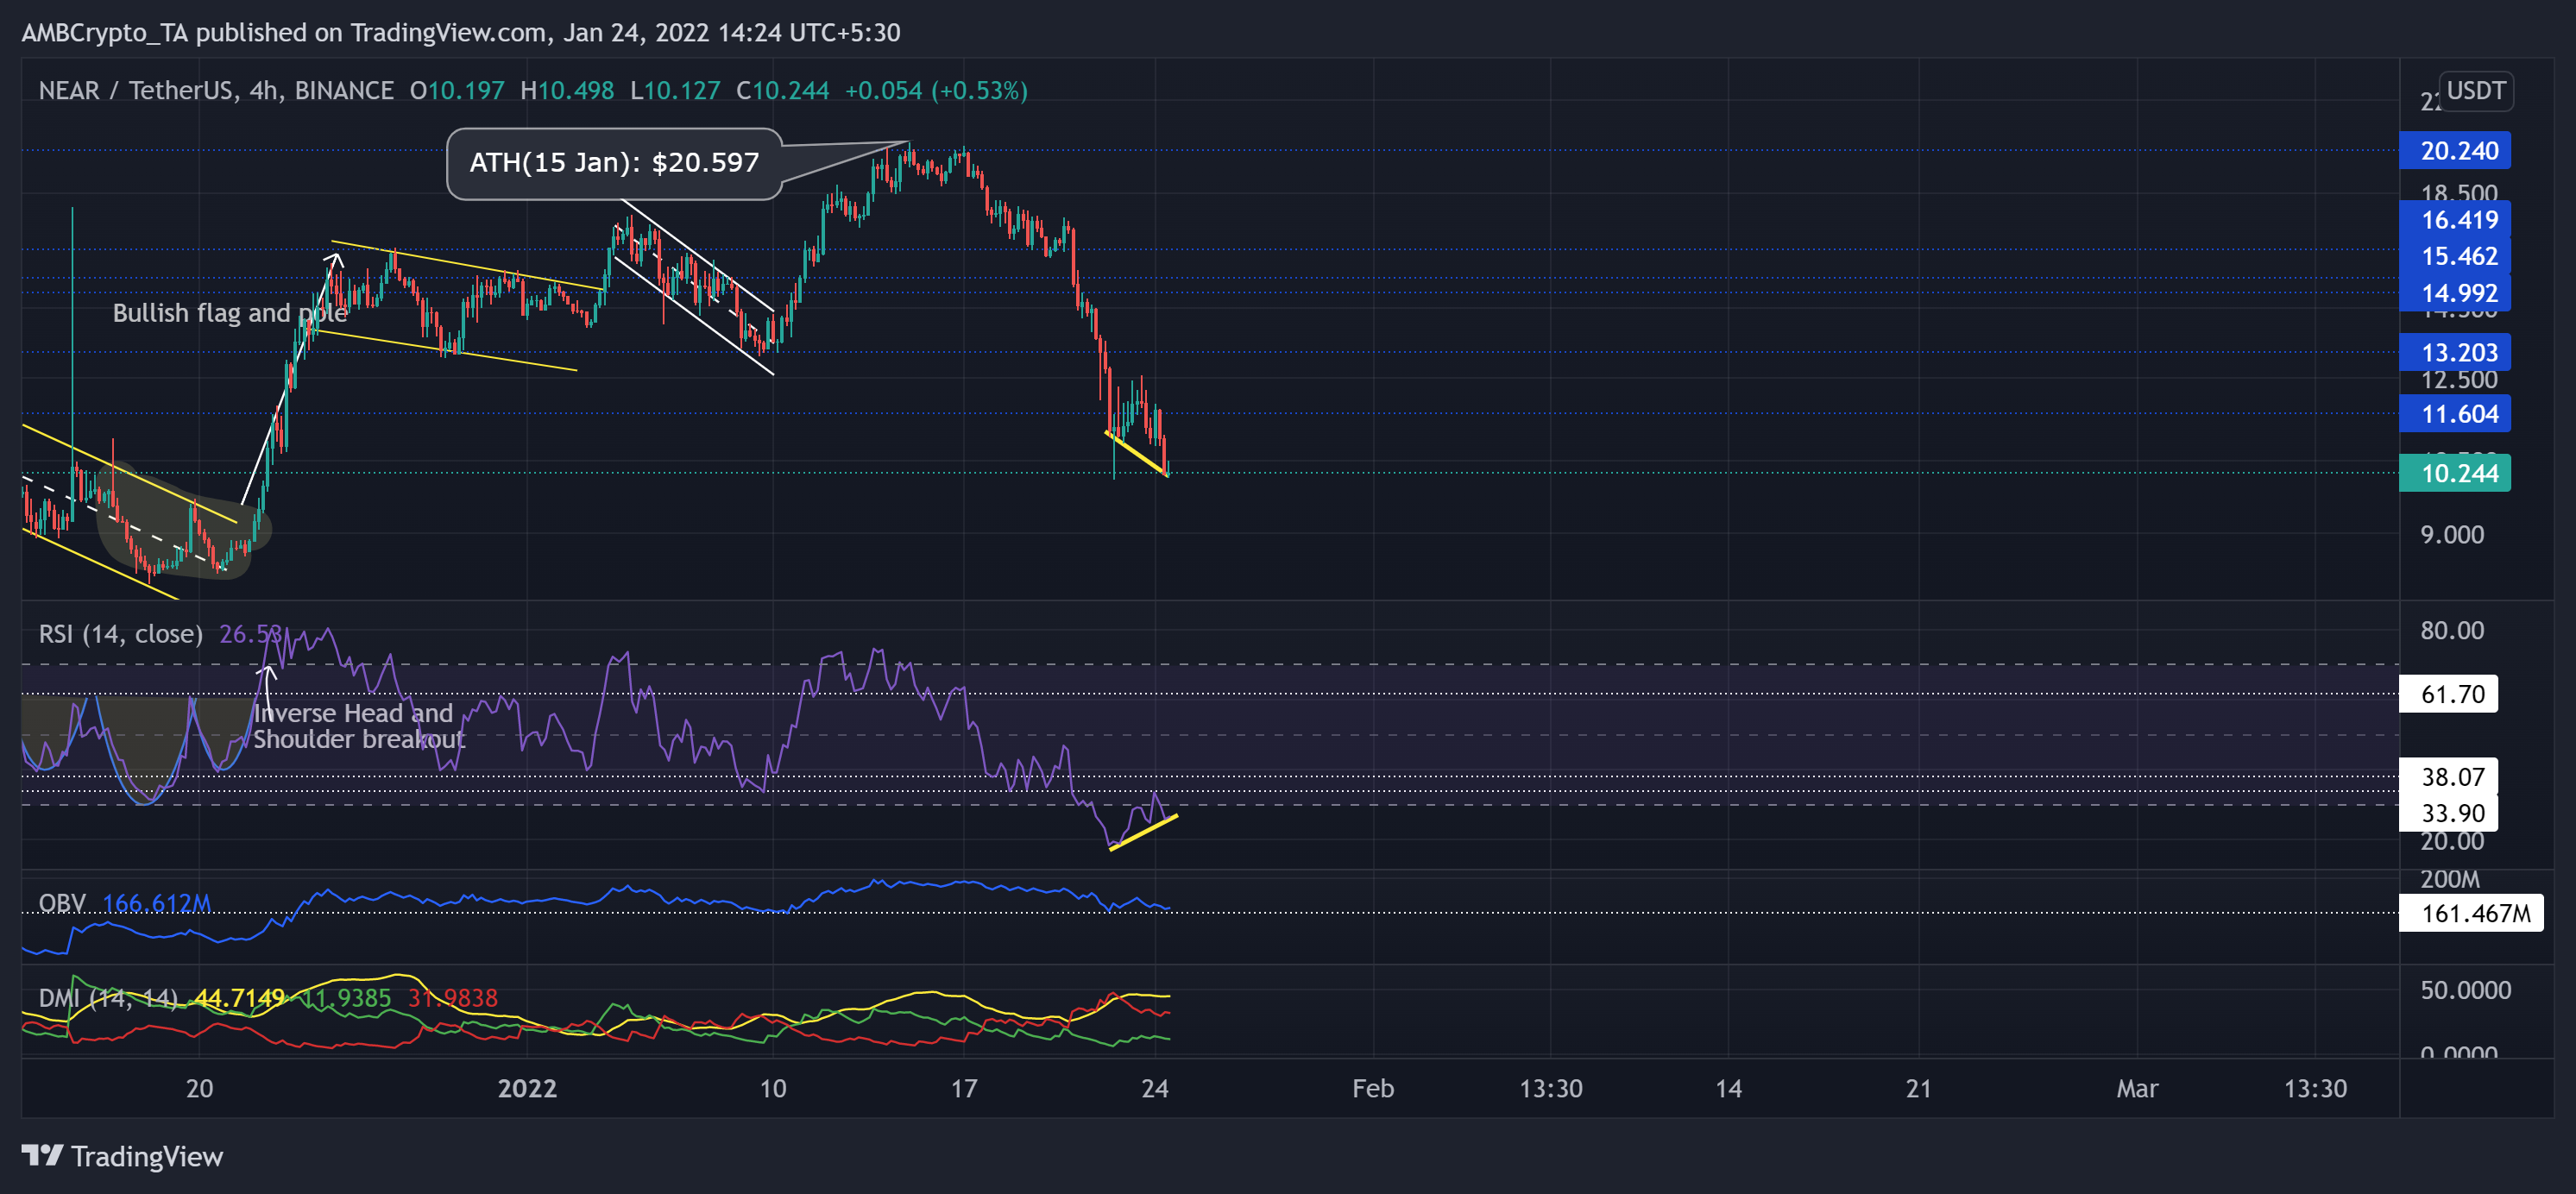
The altcoin saw an exceptional 56.7% ROI (from 10 January low) and marched toward its ATH at $20.597 on 15 January. Since then, it lost over half of its value while marking lower peaks and troughs.
At press time, the alt traded at $10.244. The RSI took a sharp 30 point plunge from 17 January and tested the 33-mark thrice. Then, after plunging to its record low at 18.4, it saw a revival after forming a bullish divergence (yellow trendline) with the price.
Interestingly, the OBV maintained its support that upheld higher prices over the past week. This reading displayed a potential comeback possibility for the bulls. However, the DMI continued to flash a bearish bias.


