Litecoin traders must be prepared should this level be breached

Disclaimer: The findings of the following analysis are the sole opinions of the writer and should not be taken as investment advice
Since the first week of July, Litecoin has slowly declined in value. The digital asset started the month with a high of $146, but the formation of a down-channel dragged its price below multiple support levels. While it does have certain upgrades lined up that according to Charlie Lee could be true “game-changers,” LTC’s performance on the charts is yet to reflect any bullish sentiment.
At the time of writing, Litecoin was being traded at $121.15, down by 3% over the last 24 hours.
Litecoin 4-hour chart
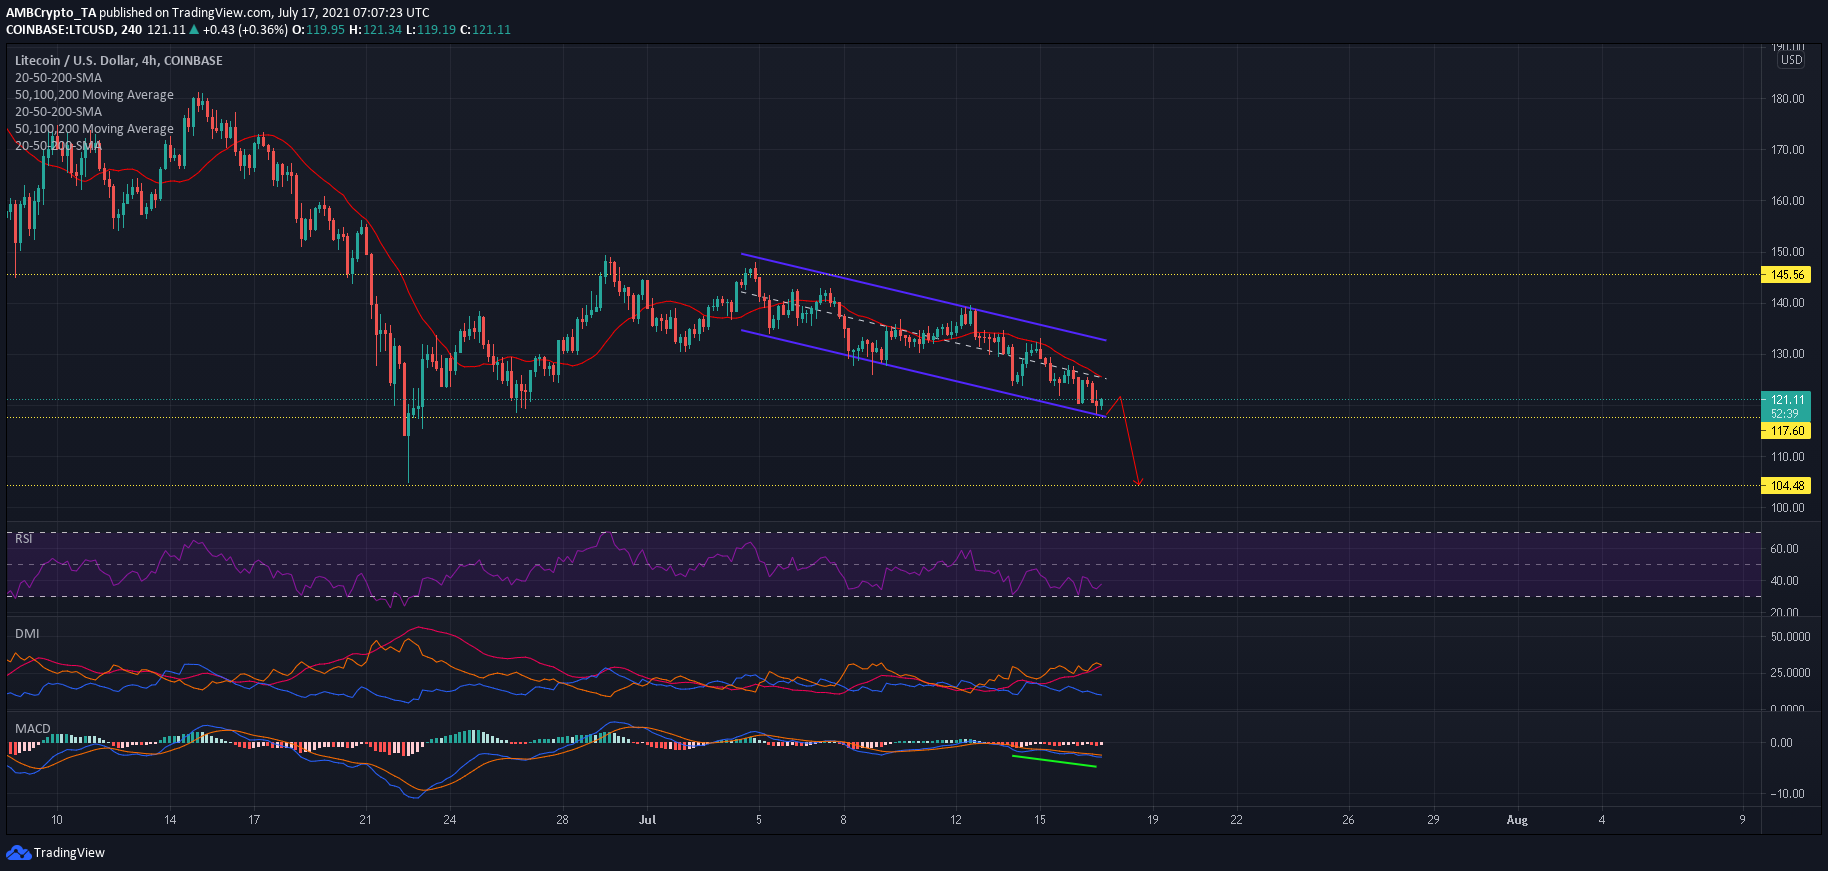
LTC’s down-channel emerged once the price was unable to break above the $150-ceiling on its second attempt post the crypto-plummet. As LTC oscillated between the two downwards sloping trendlines, its value declined by nearly 20% from the highest to the lowest point of the pattern. At press time, the price was heading towards the crucial support mark of $117.6 – A region that cushioned LTC’s fall on 23 May.
Market bulls can be expected to offer some fightback at this level and contain any short term-losses, but a close below this level could drag the price to its 22 June swing low of $104.5 – representing additional losses of 13%. To support a bullish outcome, LTC needs to rise above the $126-mark as this would coincide with the 20-SMA (red) and half-line of its pattern.
Reasoning
According to the Directional Movement Index, a bearish trend was strengthening as the -DI and +DI lines diverged. An ADX reading of 29 suggested that sharp price swings were possible due to a more directional market.
The Relative Strength Index was observed to be in bearish territory, but did point north at press time. A move above 40 would be backed by some buying resurgence. Finally, the MACD line continued its descent and confirmed LTC’s price action, although the histogram did note some choppy momentum too.
Conclusion
Due to the lack of clear signals, finding LTC’s next resting zone is arduous. The alt’s price is yet to breach the critical support zone of $117.6 and there is a chance that the market’s bulls could maintain their losses within this region. In case the defense is penetrated, the next support area rested at its 22 June swing low of $104.5.