MATIC’s short-term price action depends on whether or not this happens

While several altcoins recorded strong weekly recoveries post 19 May, MATIC remains among the few that have continued to drop in the market. Over the past few weeks, the price structure of MATIC has appeared to be completely bearish, but then it is important to note that the asset itself rose more than any other altcoin too, leading to inevitable price corrections.
However, there is a major concern with respect to its dropping price at the moment, one which may define the short-term market for MATIC.
Weekly close under the 20-Moving Average?
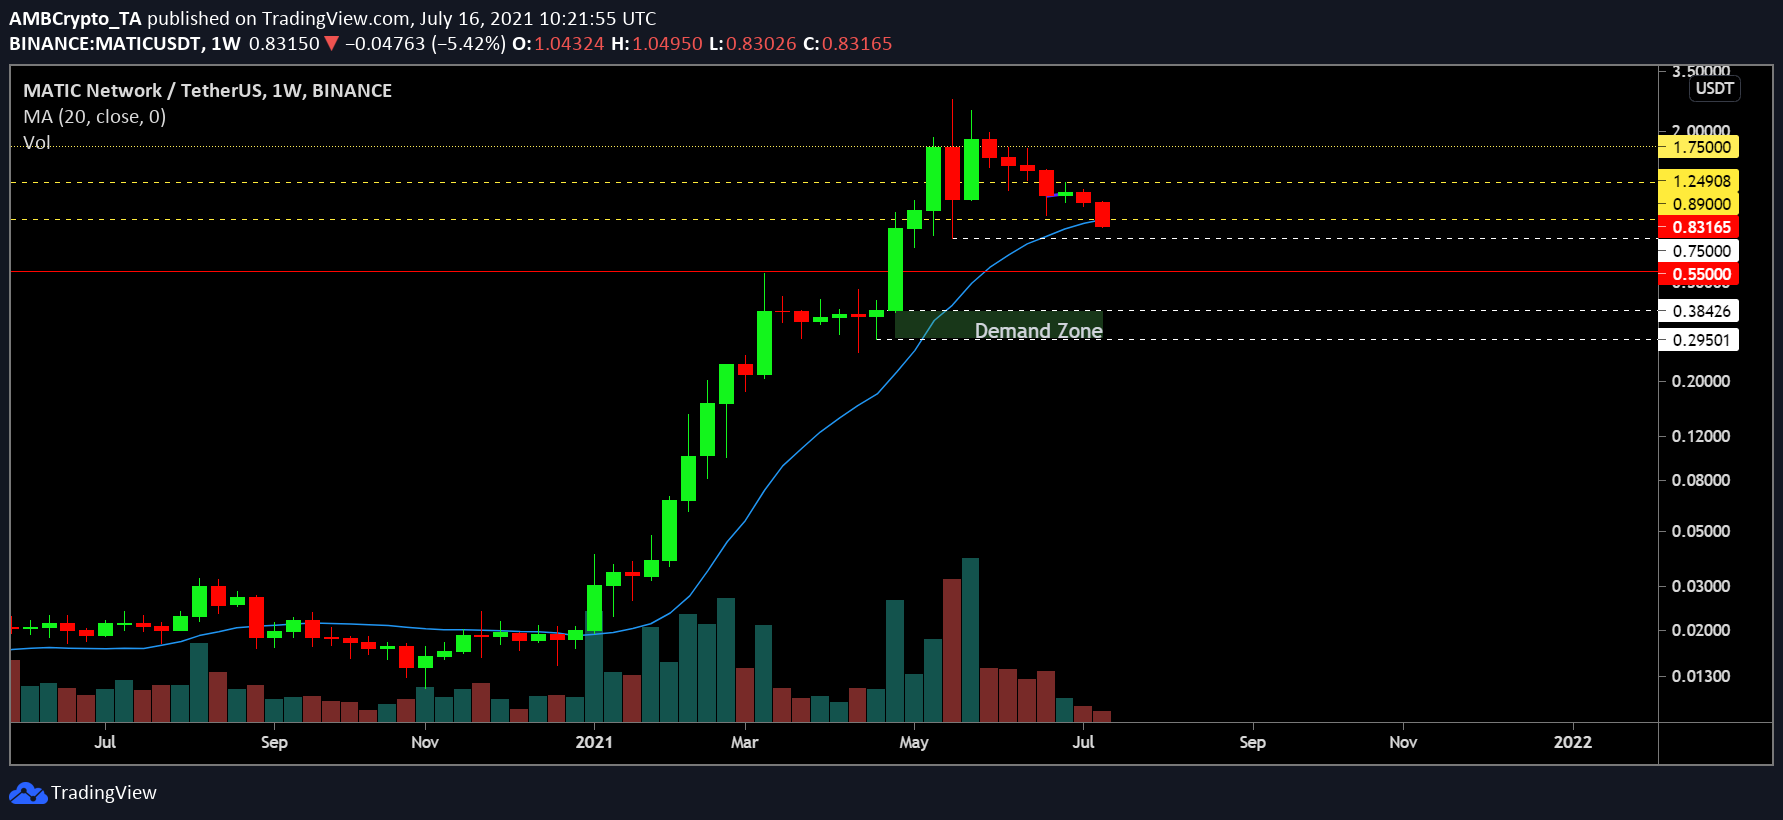
Evaluating MATIC’s weekly prices, it was found that the alt was testing the 20 period-Simple Moving Average or the 20-SMA. Fundamentally, MATIC has not closed its position below the 20-SMA since November 2020, but at this rate, it is extremely likely that the asset will end up around the $0.75 support level, a level which was tested earlier in May.
Selling volumes over the past few weeks were not really as dominant as buying pressure, but closing under the MA may further promote correction to the $0.55 critical support.
And yet, the on-chain data did present a few positives.
MATIC Price Divergence is rising
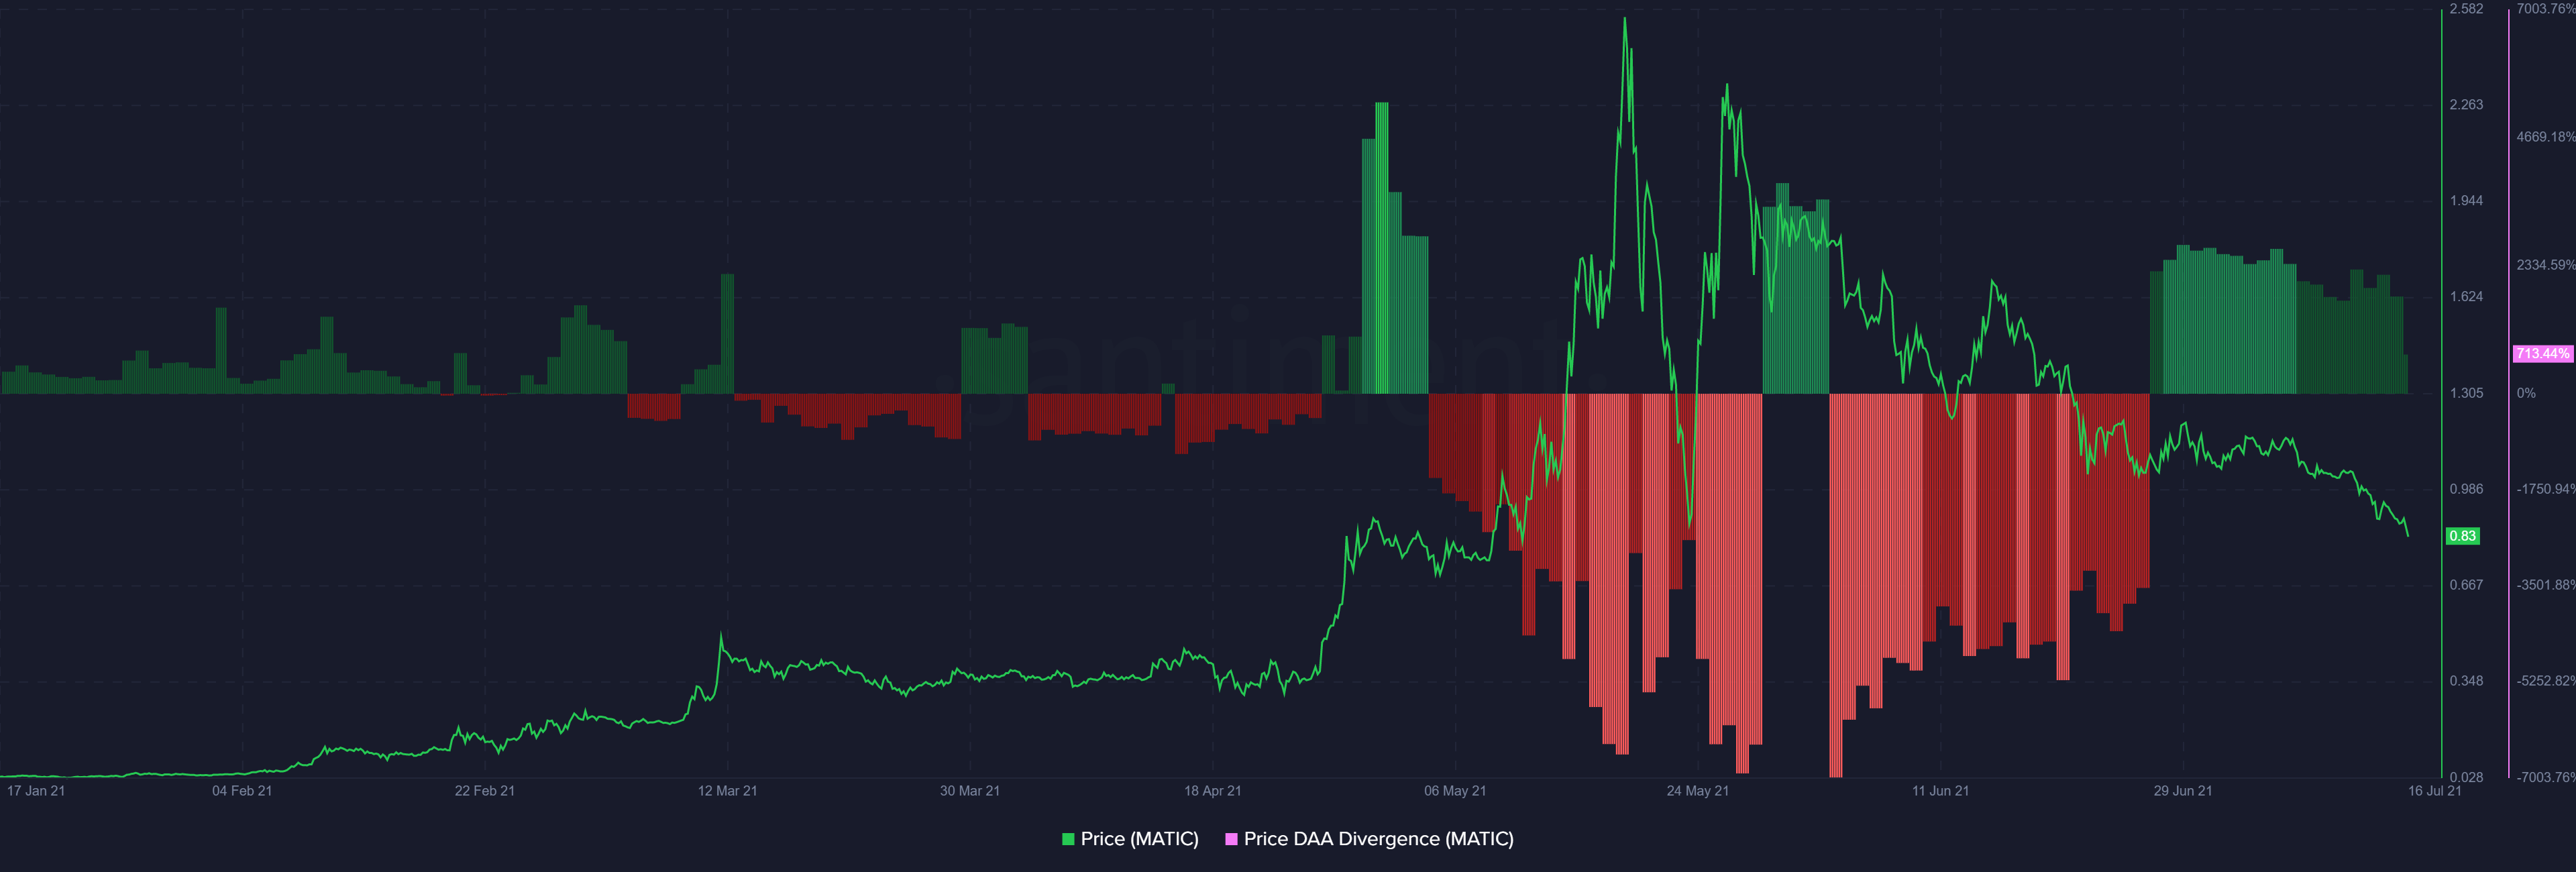
According to Santiment, MATIC’s price DAA divergence projected a strong bullish signal as the increase in daily active addresses corresponded with lower price performance. Historically, such Price DAA divergence has allowed the asset to range better in the market, and capture higher trading targets.
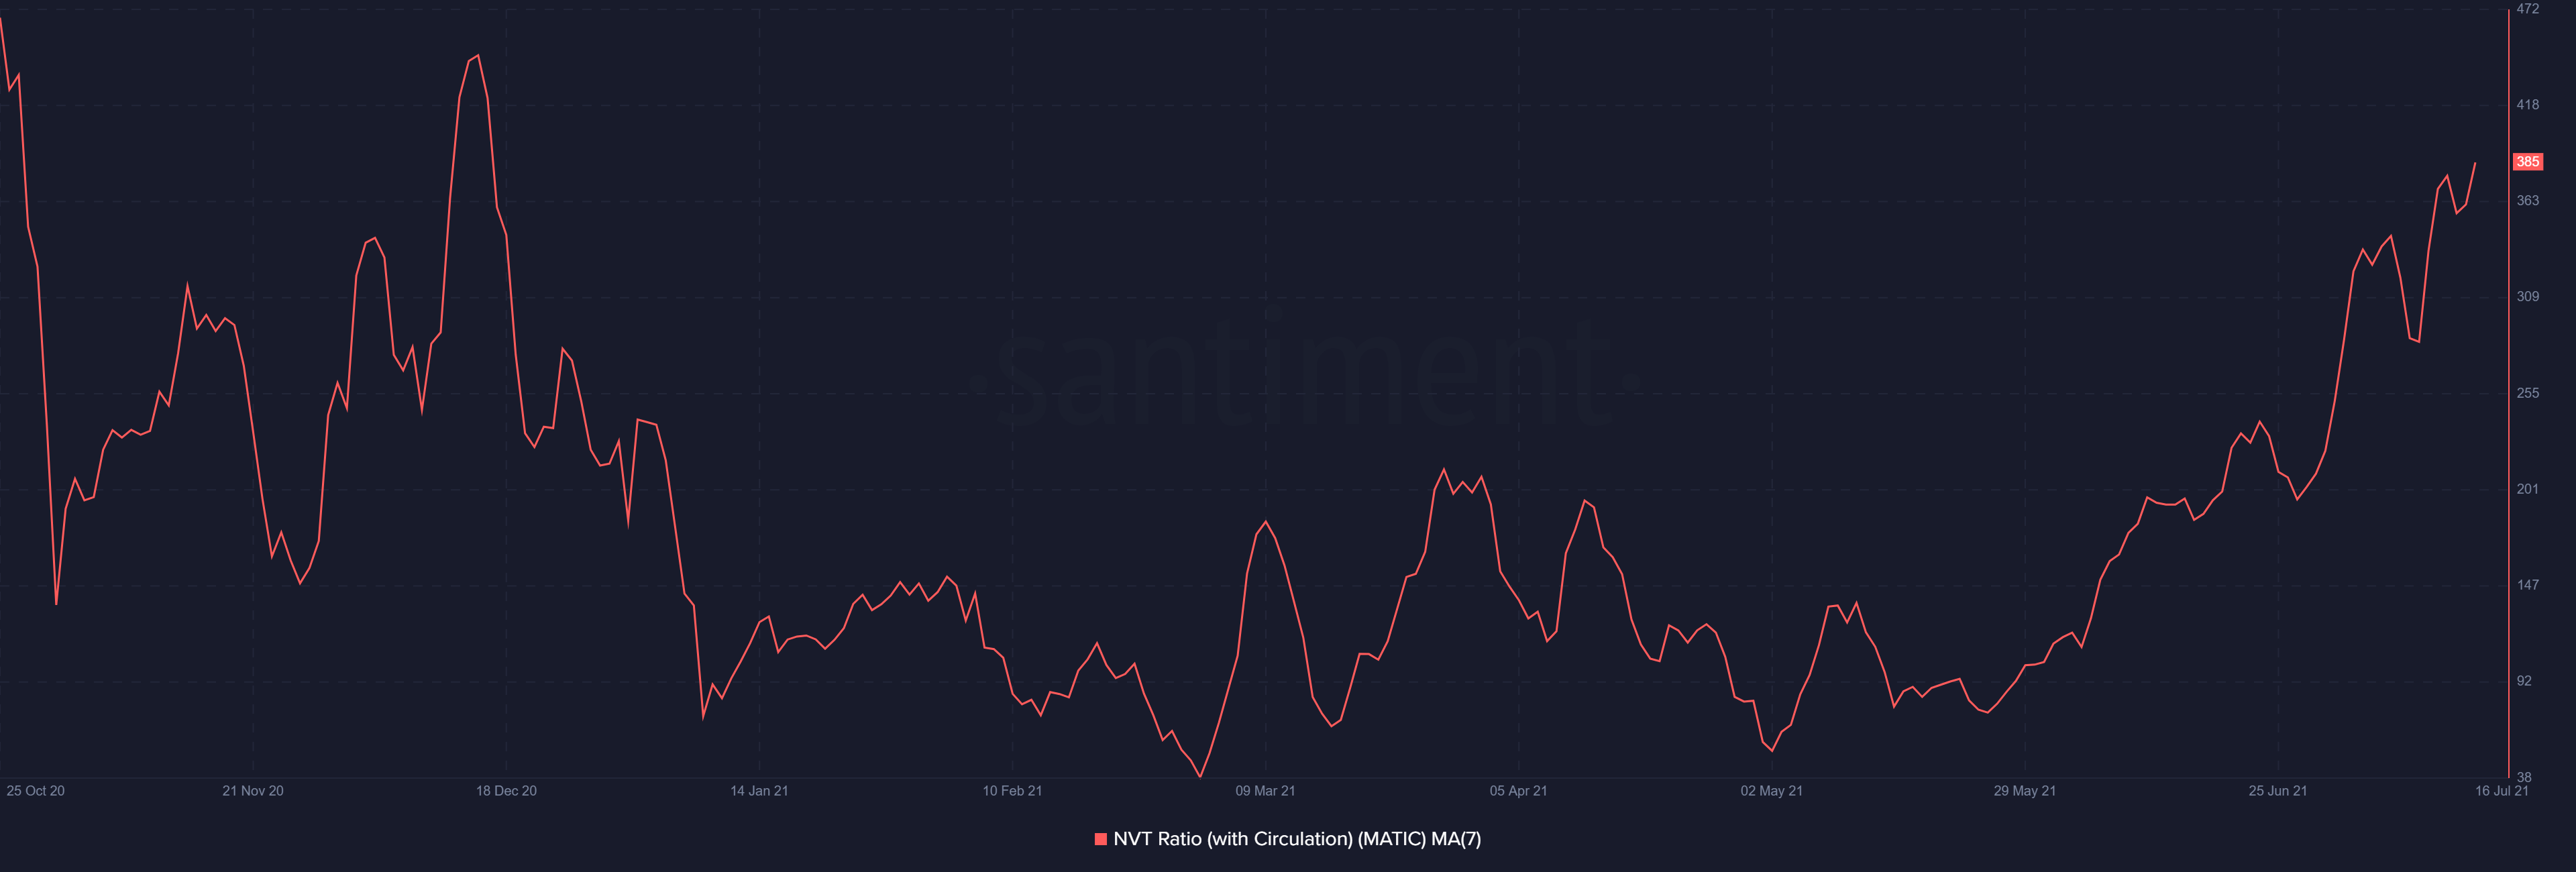
In contrast with the active addresses, MATIC’s NVT ratio also recaptured a high akin to what was last seen towards the end of December 2020. It indicated that the Network Value was starting to become overpriced and transactional volumes would need to increase in order to balance the structure. While it is bearish in nature, an overvalued network correlates to more corrections on the charts.
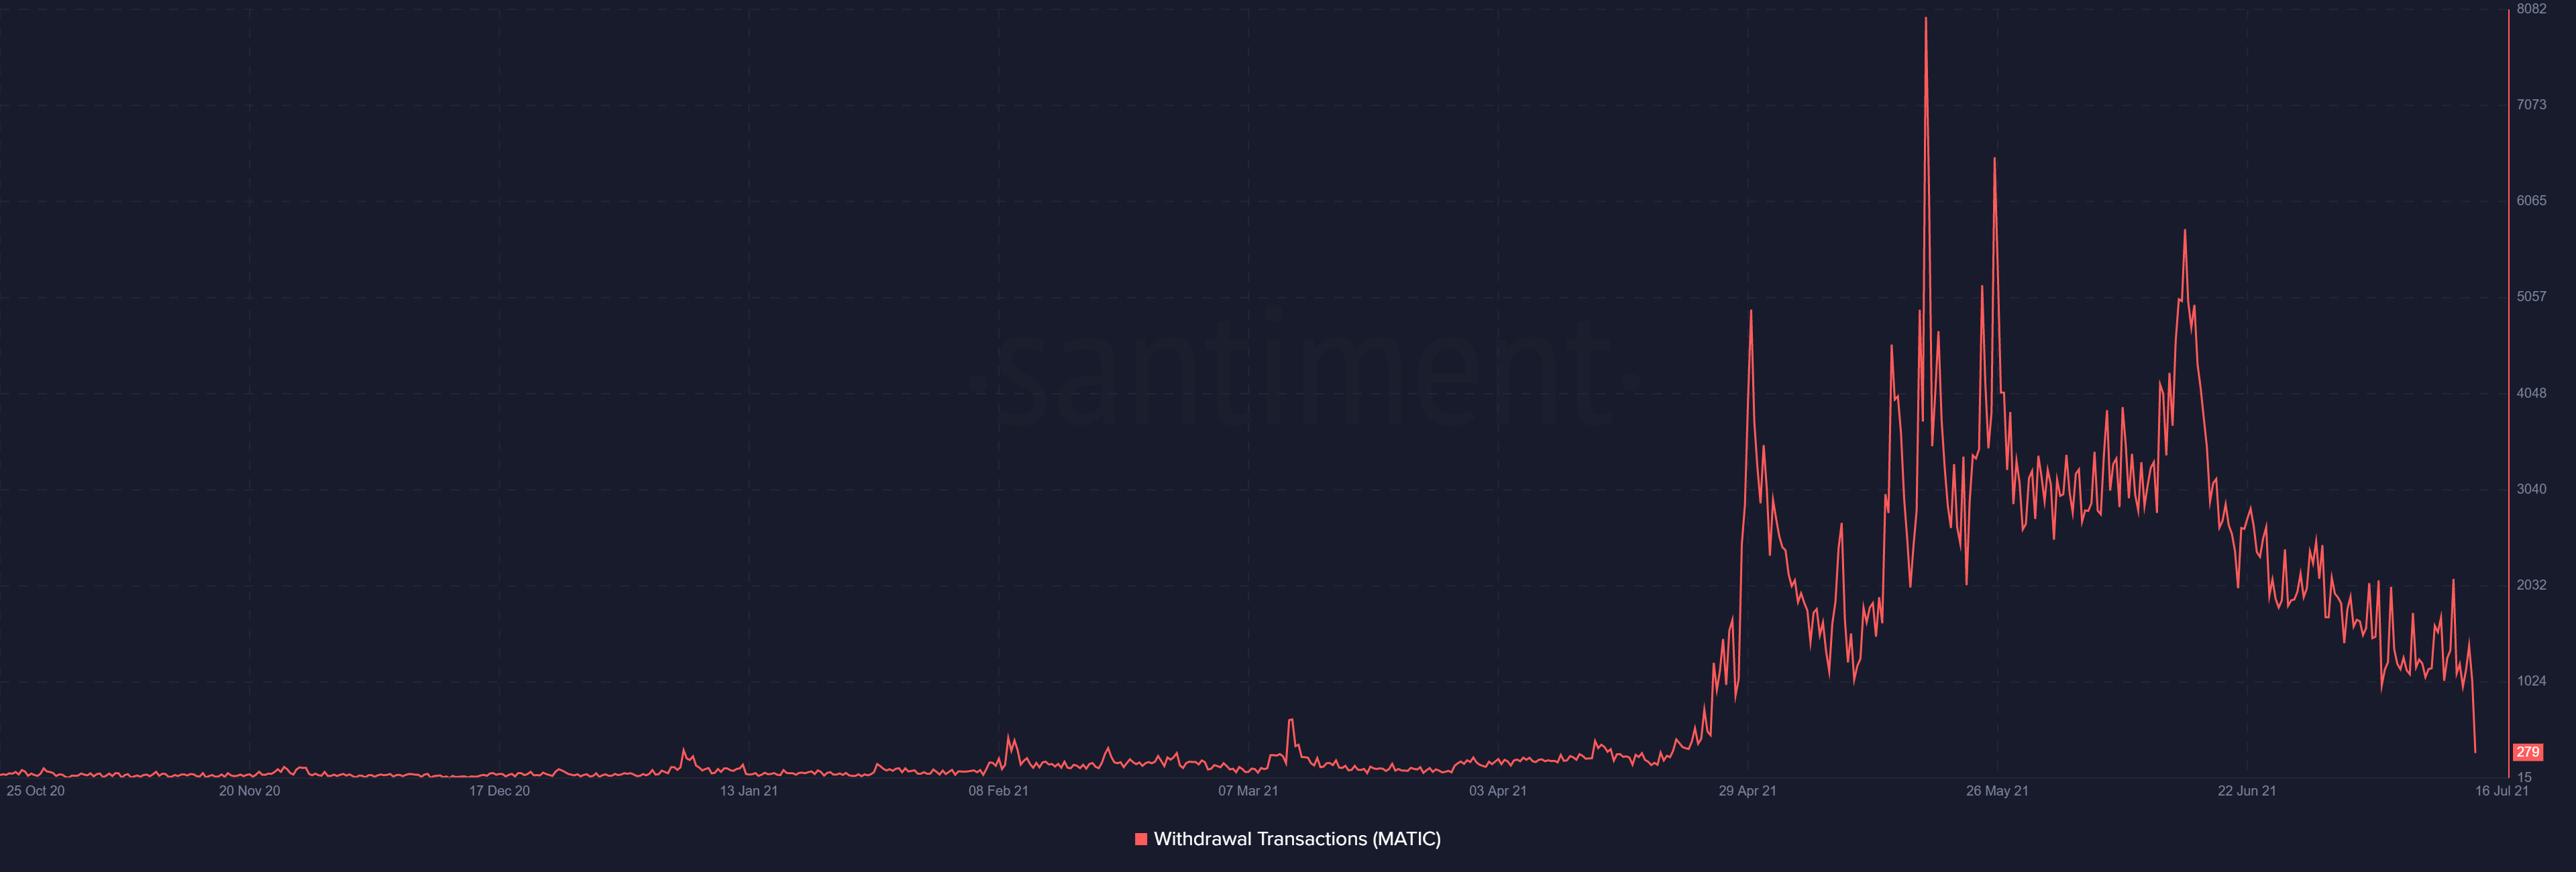
Another major blowout factor was the drop in withdrawal transactions. So, a spike in withdrawal transactions leads to an accumulation trend, and the prevailing drop might indicate the opposite. On a larger scale, unpredictability seemed to be shining through MATIC’s price action and on-chain data.
Development Side
From a development point of view, there are still some massive positives for Polygon and MATIC as the digital asset got listed recently by TrustWallet and MyEtherWallet. These integrations will only allow the asset to grow further in terms of adoption, but at the moment, it is important to understand that the bullish trigger is relevantly attached to Bitcoin’s trajectory.
The hype and buying pressure associated with major altcoins are fading. Hence, unless Bitcoin and Ethereum cross their respective bullish targets, it is difficult for MATIC to scale as well.