With Bitcoin heading back towards $35,000 at the time of writing, bearish sentiment was persistent for most alts in the market. Similarly, altcoins such as Litecoin, Tron, and Uniswap halted their recovery attempts and looked to revisit certain support levels on each of their respective charts.
Litecoin [LTC]
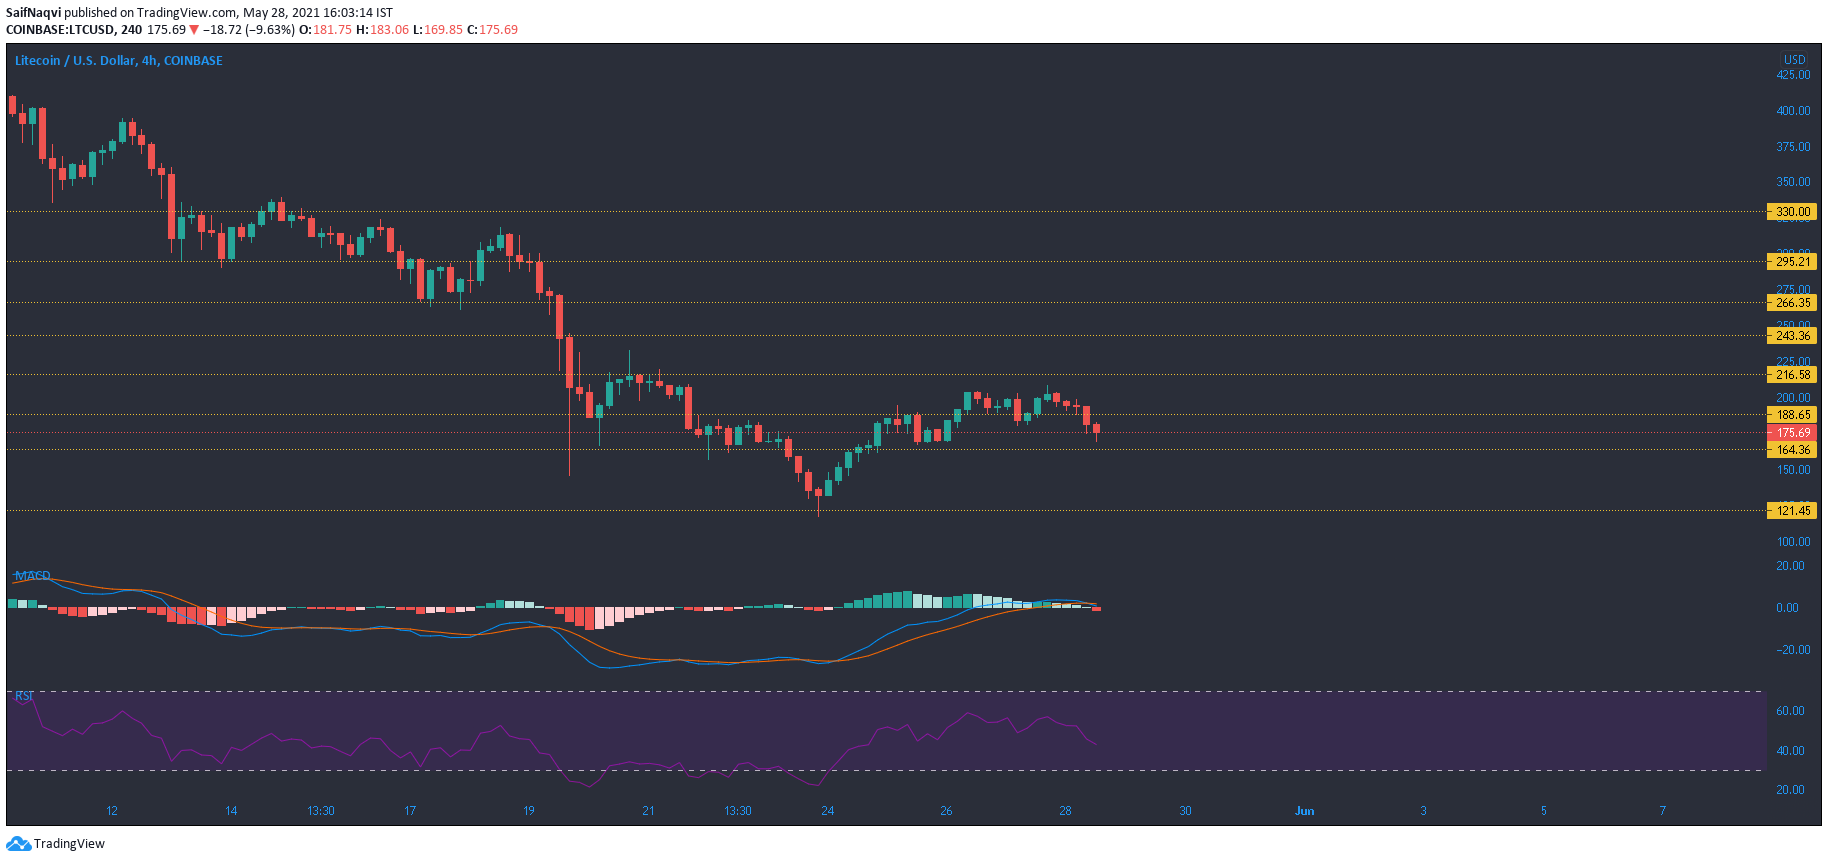
Source: LTC/USD, TradingView
Levels mentioned in a previous analysis were under the spotlight once again as Litecoin dropped by 11%, at the time of writing. LTC’s losses were maintained above $164.36-$160 during earlier dips in March and holding on to this defensive line could lead to a price hike going forward. In case of a breakdown, LTC would likely test the $121.45-support – An area that was in focus post the recent crypto-dump. For a swift recovery, the market’s bulls need to target a move above $216.58.
A bearish crossover in the MACD indicated some more southbound action before LTC bulls regained lost ground. The RSI was heading towards 40, but a bounceback would deny an extended bearish outcome.
Tron [TRX]
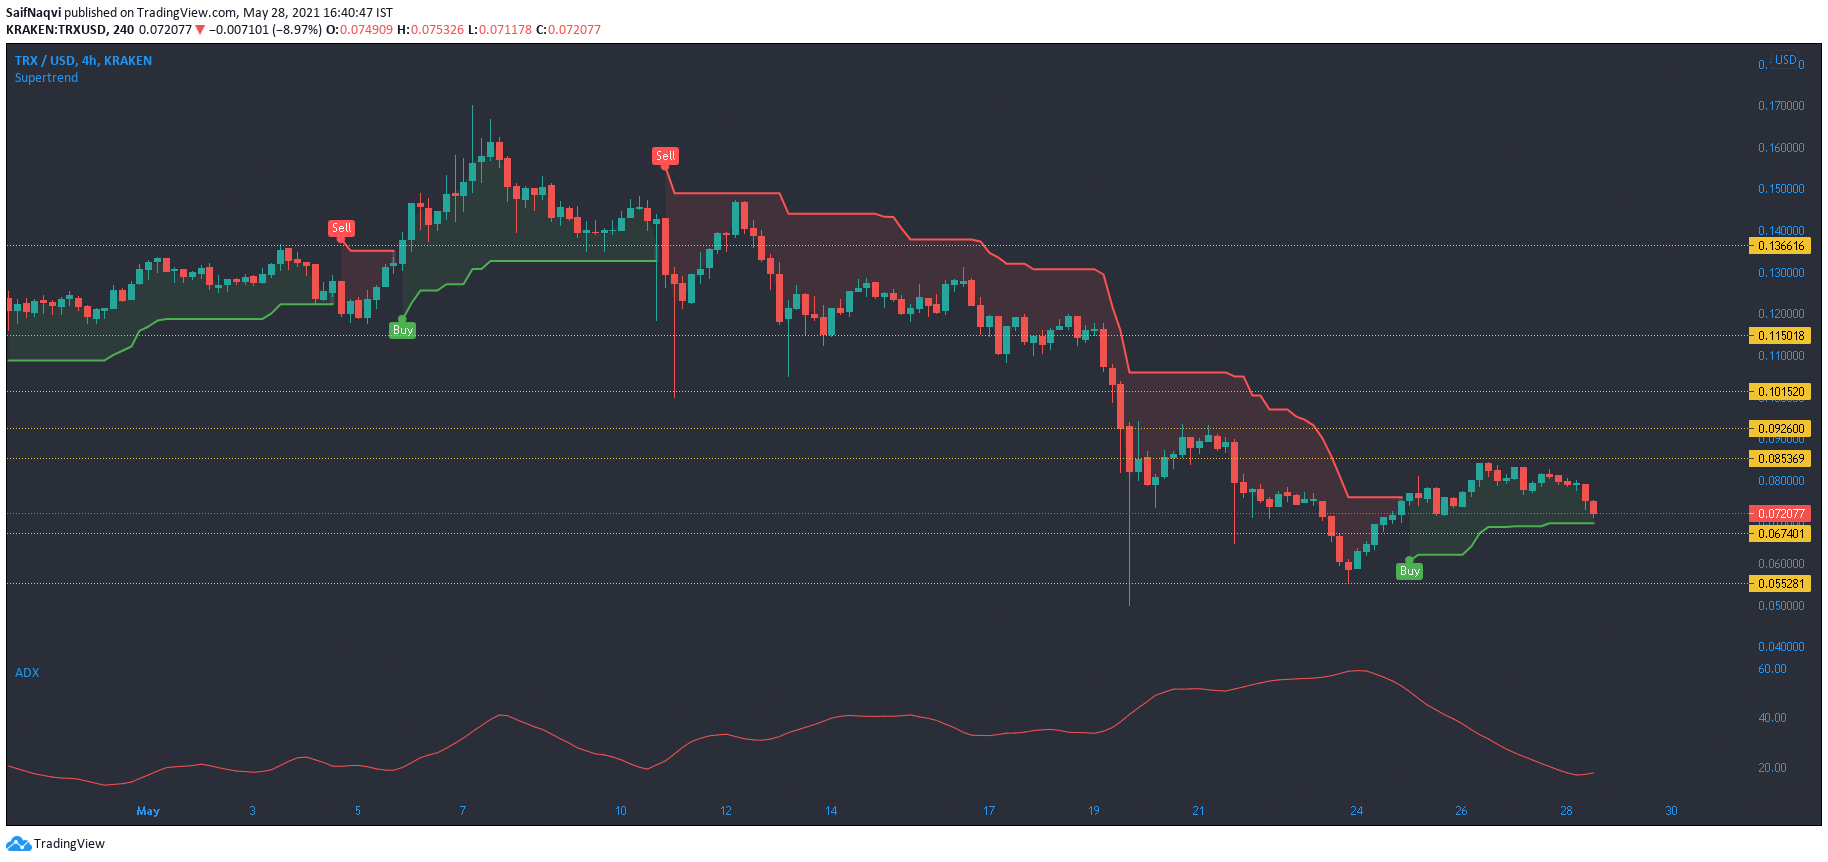
Source: TRX/USD, TradingView
Tron slipped below its 20-SMA (red) and 50-SMA (yellow) on its 4-hour chart after a failed breakout attempt above $0.085. Interestingly, the SuperTrend Indicator still flashed a buy signal at the press time price, but placed a stop-loss close to the $0.067-support. If that area is breached, Tron would face a struggle to recover over the coming sessions.
With the ADX on a constant decline over the last four days, the market was becoming less and less directional. This also prevented a breakout attempt as TRX’s rise from $0.055 to $0.085 lacked the strength to trend in an upwards direction. In case of a breakdown from its press-time support, TRX could shift back towards $0.055.
Uniswap [UNI]
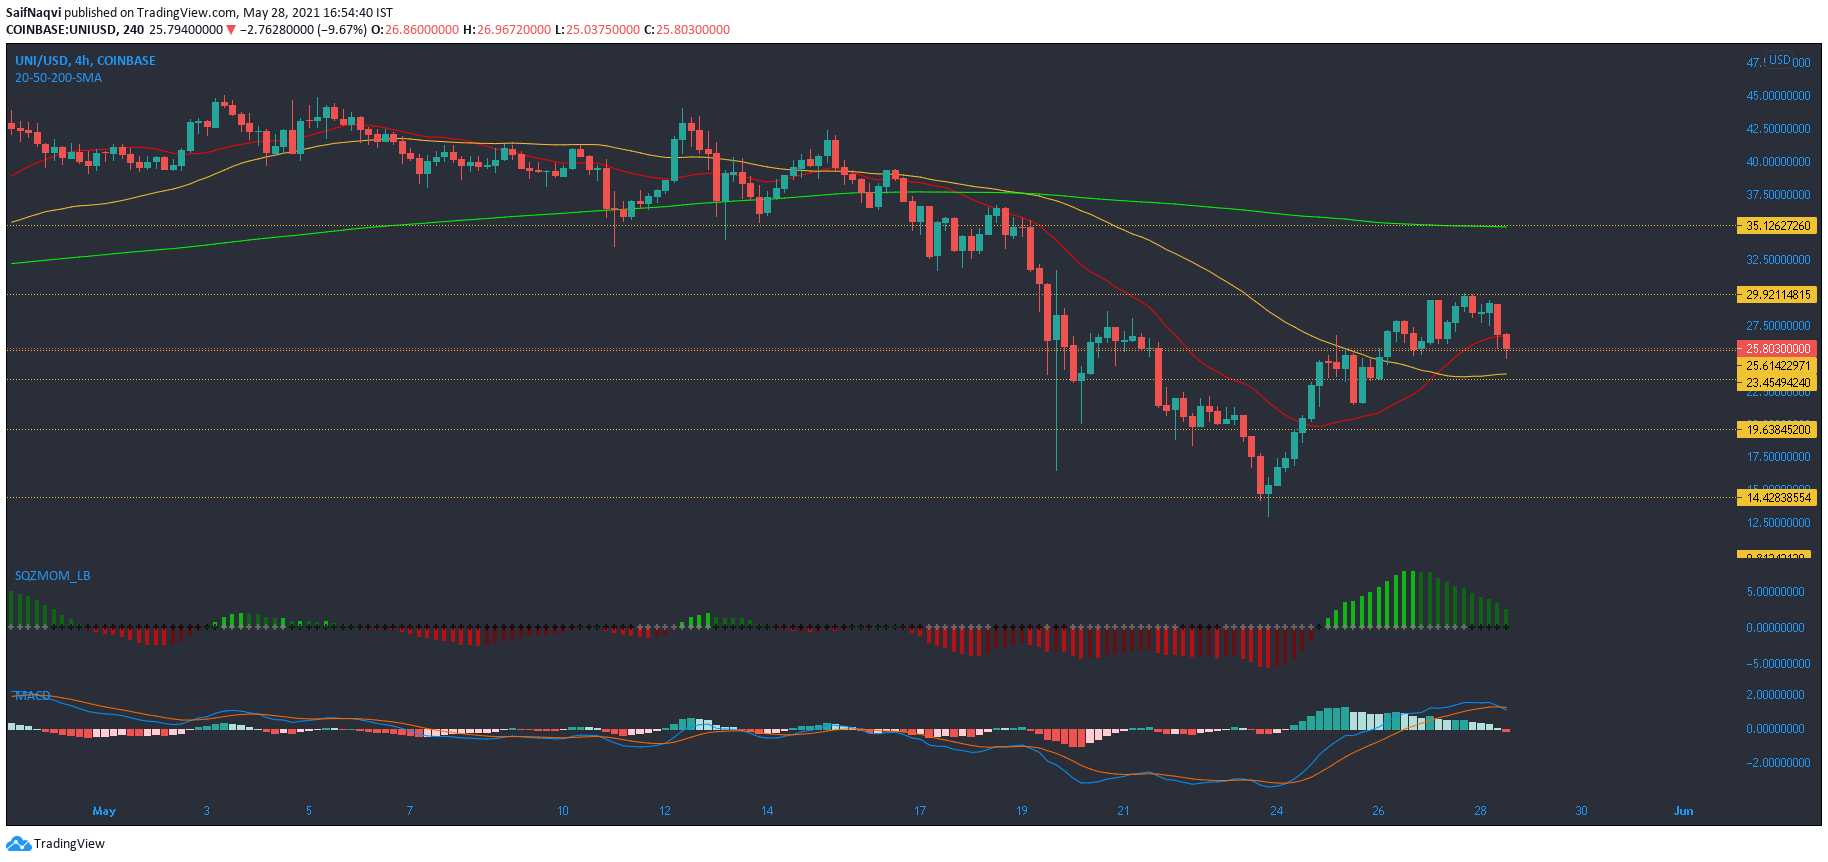
Source: UNI/USD, TradingView
Even though Uniswap dropped by 10% over the last 24 hours, its losses were not that steep when compared to some other alts. A look at its chart showed that the bulls had slightly more leeway between $23-24 before attempting a comeback. If a breakdown takes place, additional areas of defense resided at $19.6 and $14.4. Conversely, a northbound move above $30 could trigger a 35% jump towards its 200-SMA (close to $35).
However, the Squeeze Momentum Indicator’s trajectory seemed indicative of another bearish run. The first red bar followed by a light dot would present a sell signal and lead to extended losses. The MACD’s bearish crossover highlighted a shift in market dynamics once again.