Litecoin, VeChain, Ethereum Classic Price Analysis: 17 January

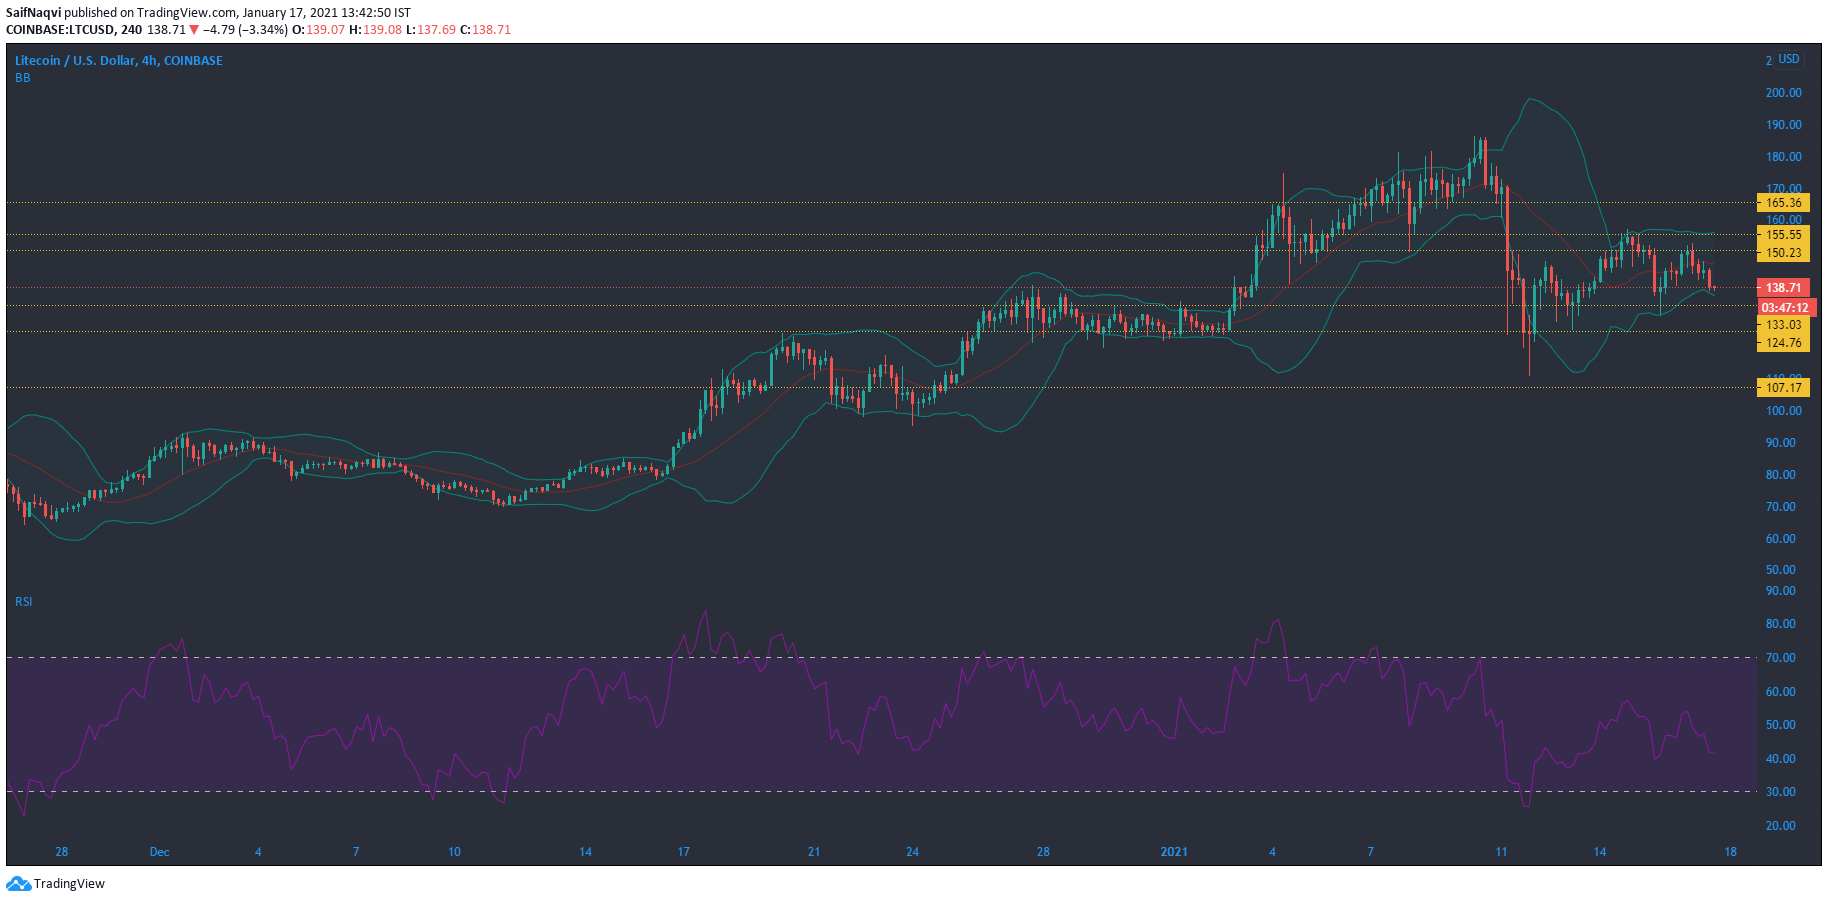
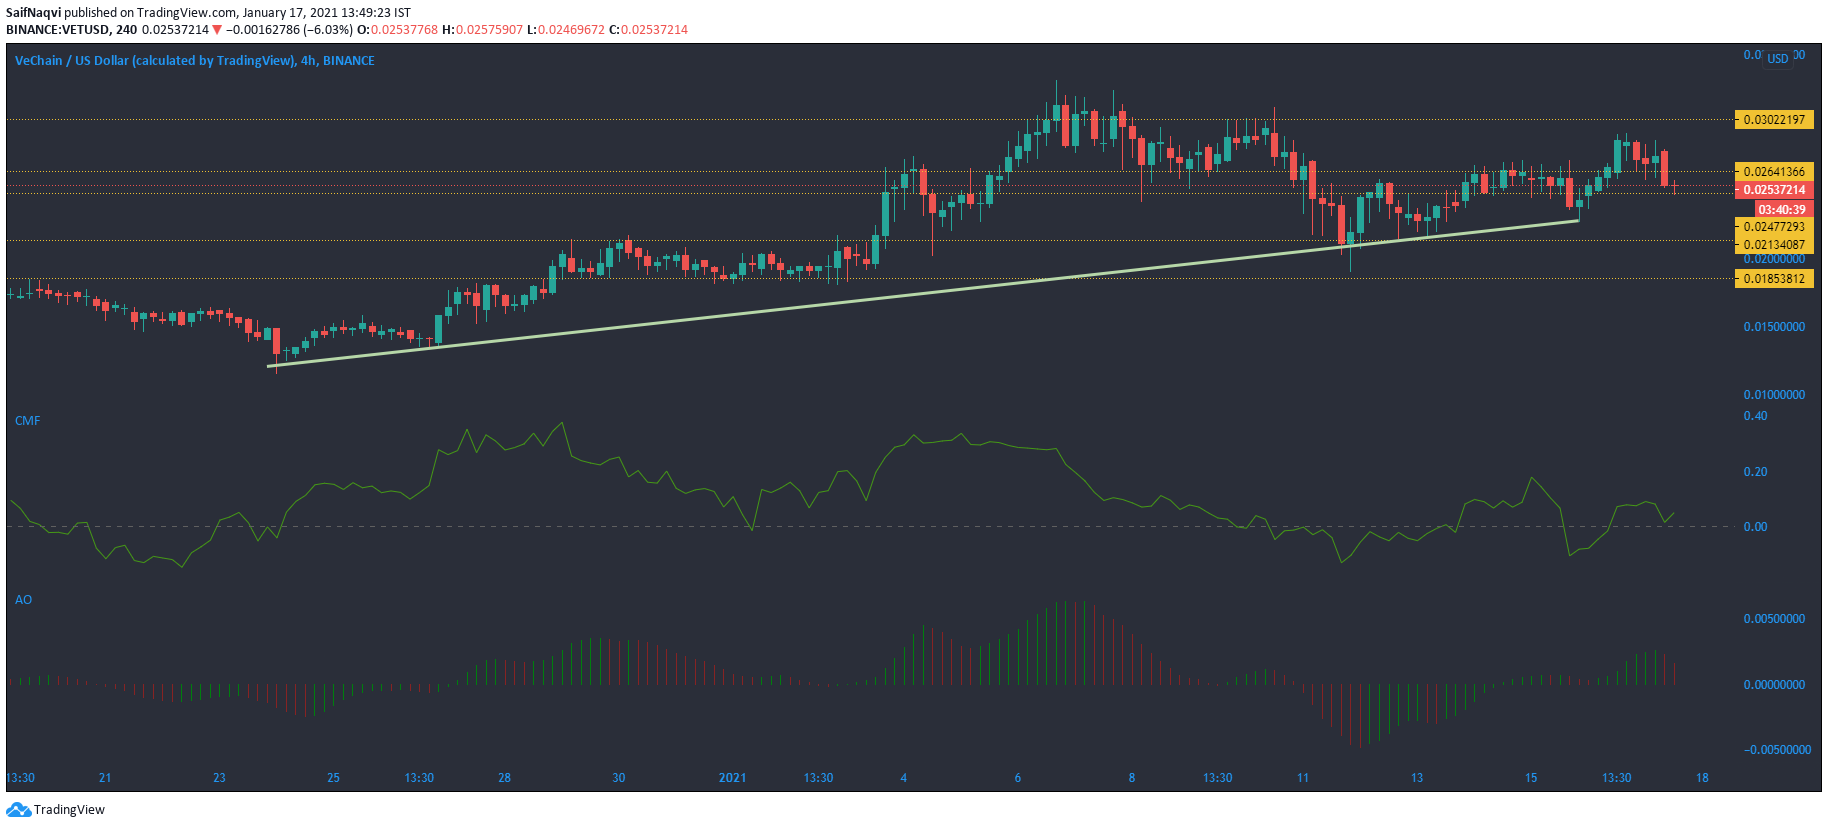
Litecoin struggled to break above its current resistance, and sellers pushed prices towards $133.03 support. VeChain retested $0.026 and moved lower as buyers struggled to maintain control of the price while ETC traded within a restricted channel and relied on broader market cues for its path forward.
Litecoin [LTC]

Source: LTC/USD, TradingView
Most of Litecoin’s gains since the start of the month were negated after Bitcoin’s correction dragged LTC towards its $124.7 support. In fact, LTC’s weekly fall of over 22% was the highest among the top 10 cryptocurrencies by market cap. At the time of writing, LTC’s price was trading between $133.03 and $150.2 and seemed bearish. On the flip side, a broader market rally could boost its price above the upper ceiling and push them towards $155.5.
The Relative Strength Index was moving lower from the neutral zone, a sign of the price being bearish.
The Bollinger Bands indicated that the price could remain constricted over the next few sessions, as the bands were compressed.
VeChain [VET]

Source: VET/USD, TradingView
After a breakout from the $0.026 resistance, VeChain retested the level once again. For now, sellers seemed to be in control and the price moved back towards its $0.024 support. On the other hand, a bullish scenario could see prices head towards the next resistance mark at $0.030.
Although the Awesome Oscillator registered two points of bearishness, it indicated a potential shift of momentum towards the market bears.
Lastly, Chaikin Money Flow suggested that capital inflows could keep prices from falling below their present support level.
Ethereum Classic [ETC]

Source: ETC/USD, TradingView
At press time, Ethereum Classic was trading at $7.43, up 1.48 percent in the past 24 hours. Despite the move into green territory, ETC has been largely uneventful in the last few days. Prices have traded between a thin channel of $9.66 and $8.34, with momentum resting with neither the bulls nor the bears. The period of inactivity could perhaps be justified by slow growth in market leaders BTC and ETH, since the correction. A broader market trend could define a path forward for ETC, but for now, prices could continue to trade within their present channel.
The MACD was bearish-neutral as the red bars stayed below the zero line.
If the Stochastic RSI continued its trajectory into the oversold zone, and prices could fall and test the next support at $$7.77.


