Litecoin, Waves, FTX Token Price Analysis: 21 December

Litecoin shot upwards and sailed past the $100-level of resistance while Waves faced strong selling pressure and ceded a level of support to the market’s bears after it lost nearly 18% of its value within a span of five days. Finally, FTX Token exhibited a bearish divergence on the charts and it could see a dip to $4.8 shortly.
Litecoin [LTC]
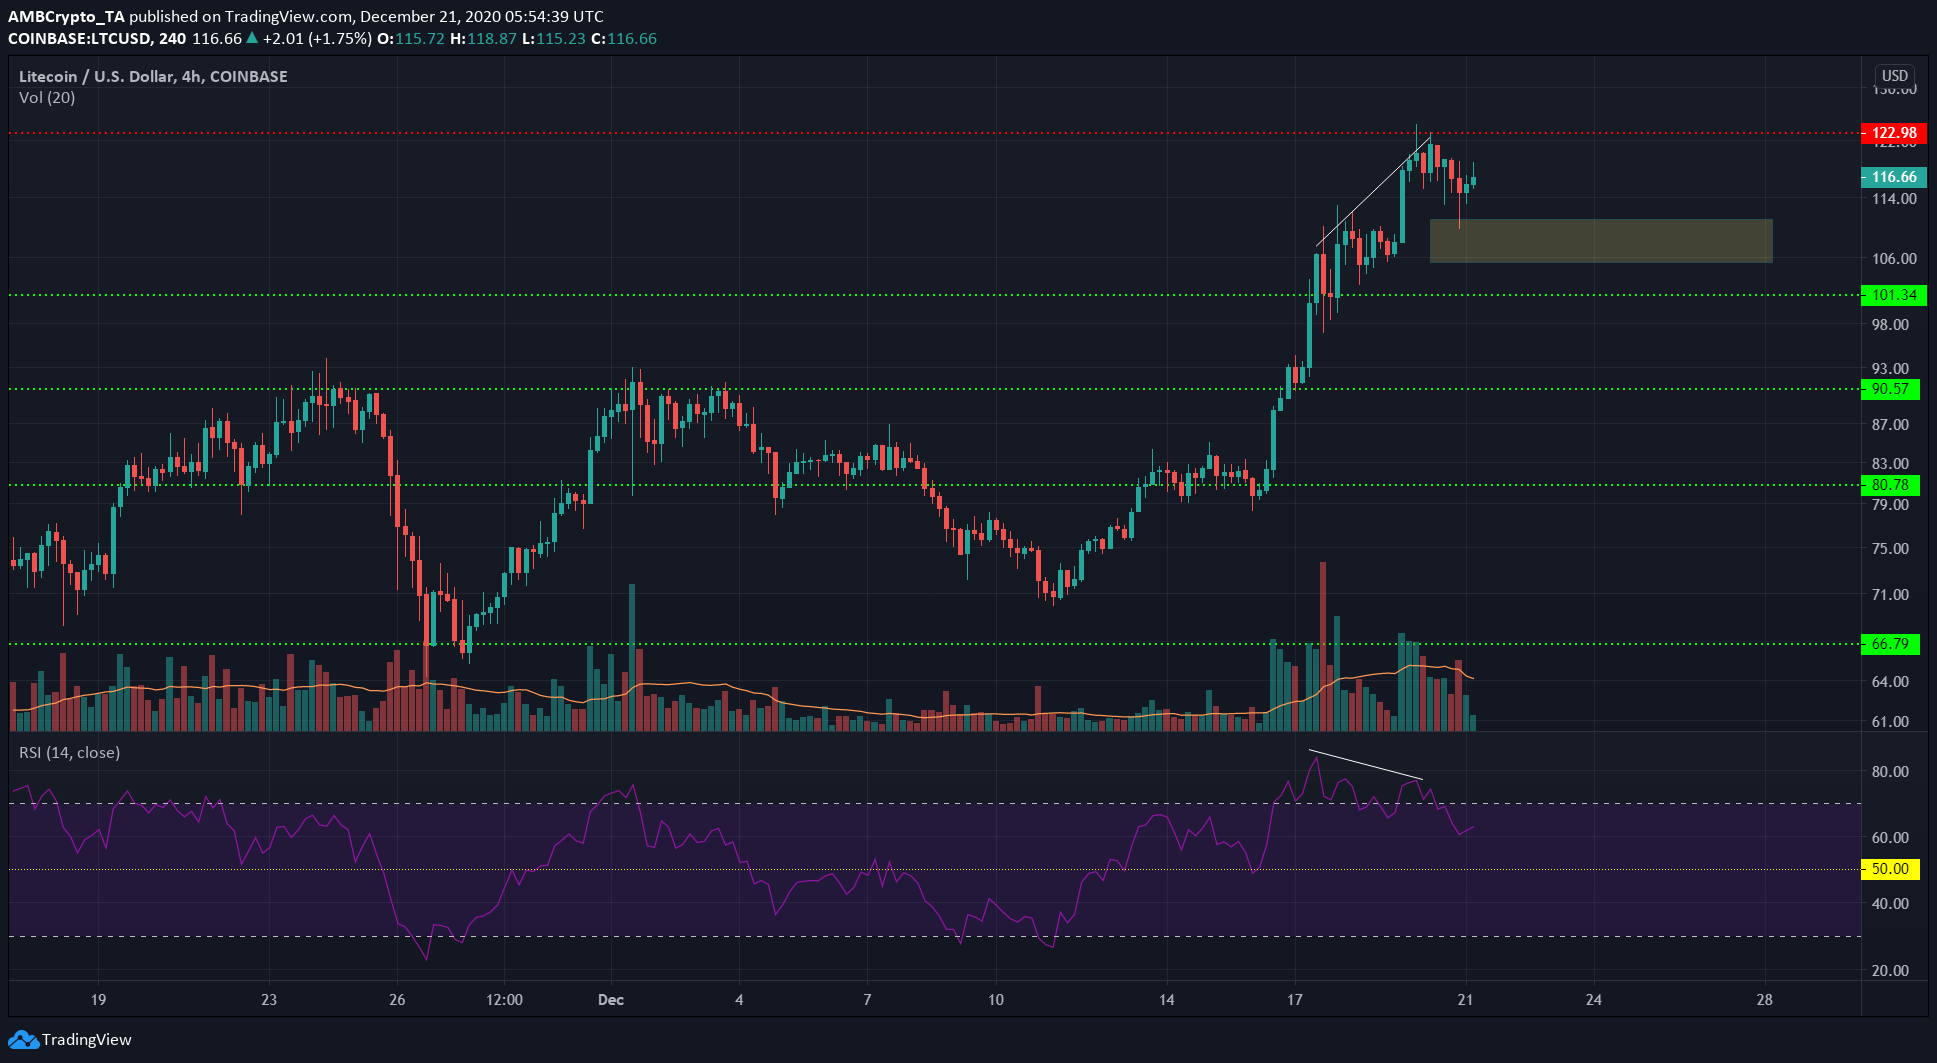
In late November, LTC dropped from $90 to $66, then climbed to retest the $90 level as resistance and gradually descended to $71. Taking the $90 and $66 as a range, we can see that the mid-range would be $78.
The $78 and $80-levels were breached a week ago, and after nearly 72 hours of consolidation above the support level, LTC broke out to the upside.
The longer-term trend behind LTC was bullish and the flip of the resistance to support at $80 highlighted the likelihood of a move upwards.
LTC subsequently broke out beyond the psychological $100-level. It showed a bearish divergence between the price and the momentum recently and it could dip once more to the region of liquidity at $105-$110.
Waves [WAVES]
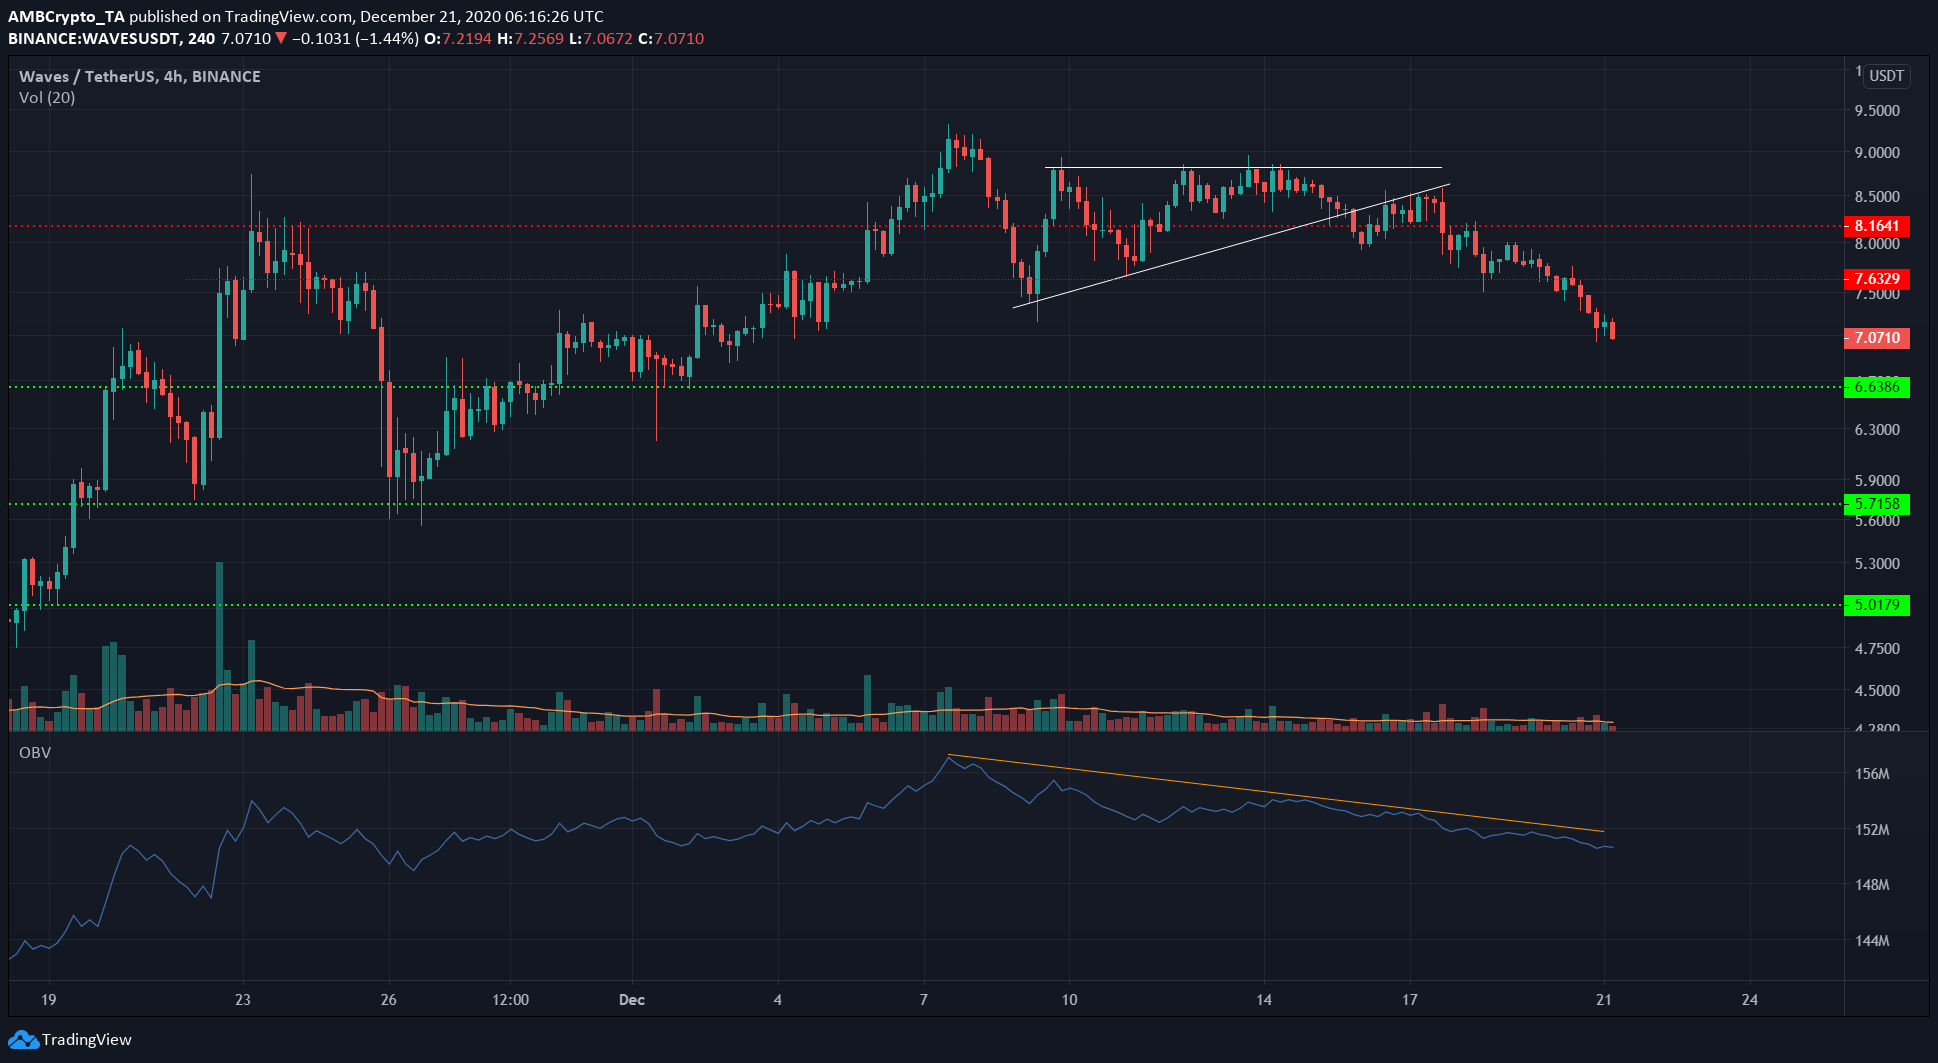
WAVES formed an ascending triangle pattern, a bullish pattern that generally sees an upward breakout. In this instance, the less likely downward breakout was forced due to mounting selling volume on the crypto-asset.
The OBV noted a short-term increase in selling volume. The price closed under the rising trendline, retested it as resistance, and dropped under the $8.18-level of support.
Following the loss of that level, WAVES shed 13% of its value and it could be set for more losses. The next level of support lay at $6.63. The level of $7.63 has been of importance in recent weeks, but the market’s bears were too strong to be halted there.
FTX Token [FTT]
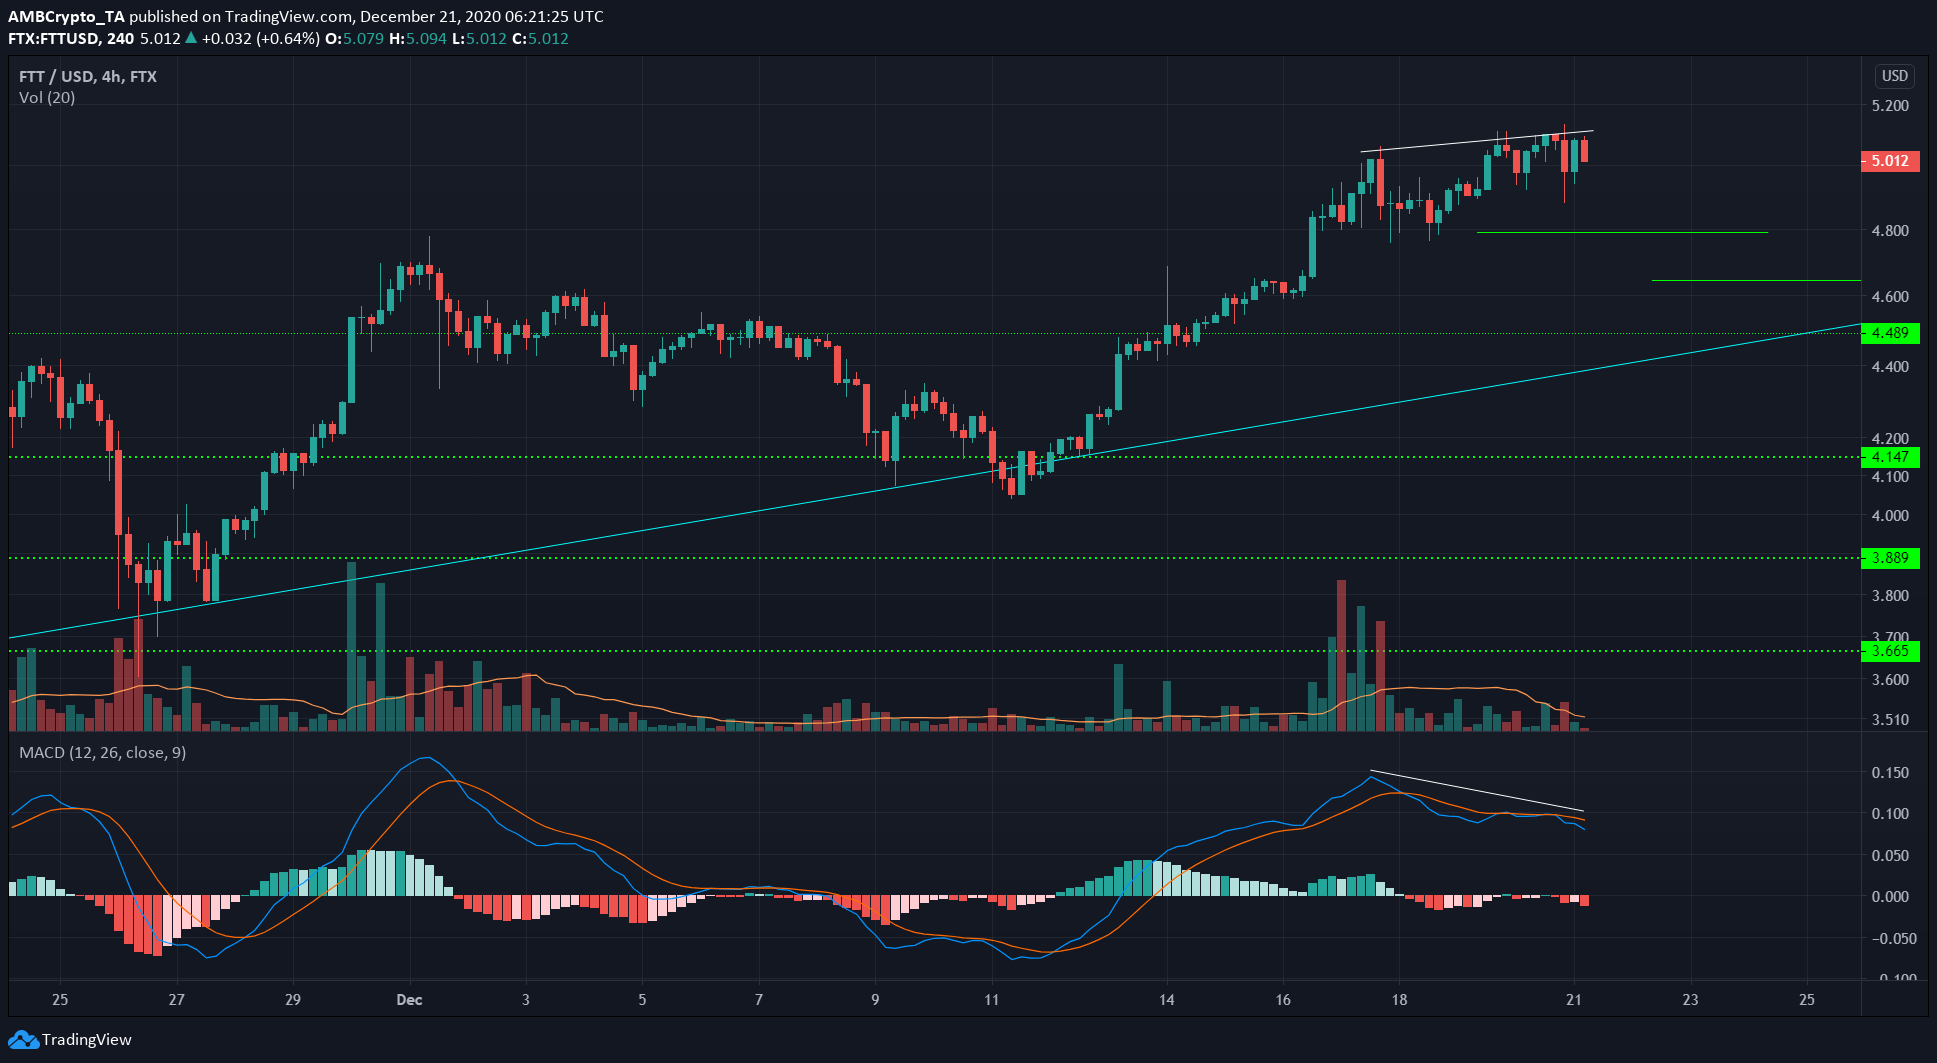
Another bearish divergence between the price and the momentum was seen, this time for FTX Token. The price made a higher high but the MACD had already begun to move lower to suggest weakening bullish momentum.
Marked by the short lines were possible supports for FTT at $4.79 and $4.65, levels where the price could bounce off of. A move beneath these could see FTT retest the $4.49-level of support.
There was some confluence with the ascending trendline support in the $4.5 region if FTT was to fall as low as that in the coming days. The trendline marked FTT’s uptrend from $3.3 in early November.


