Litecoin: What this bullish pattern means for the crypto

Disclaimer: The findings of the following analysis are the sole opinions of the writer and should not be taken as investment advice
Since the 7 September market sell-off, Litecoin has been making some progress on the chart. Three higher lows coupled with steady highs at the 38.2% Fibonacci level gave rise to a bullish pattern. This can be expected to trigger a price hike.
More positives came in the form of higher volumes across exchanges and bullish trends on some of LTC’s indicators. At the time of writing, LTC was valued at $185.16 with a market cap of $12.4 Billion.
Litecoin 4-hour Chart
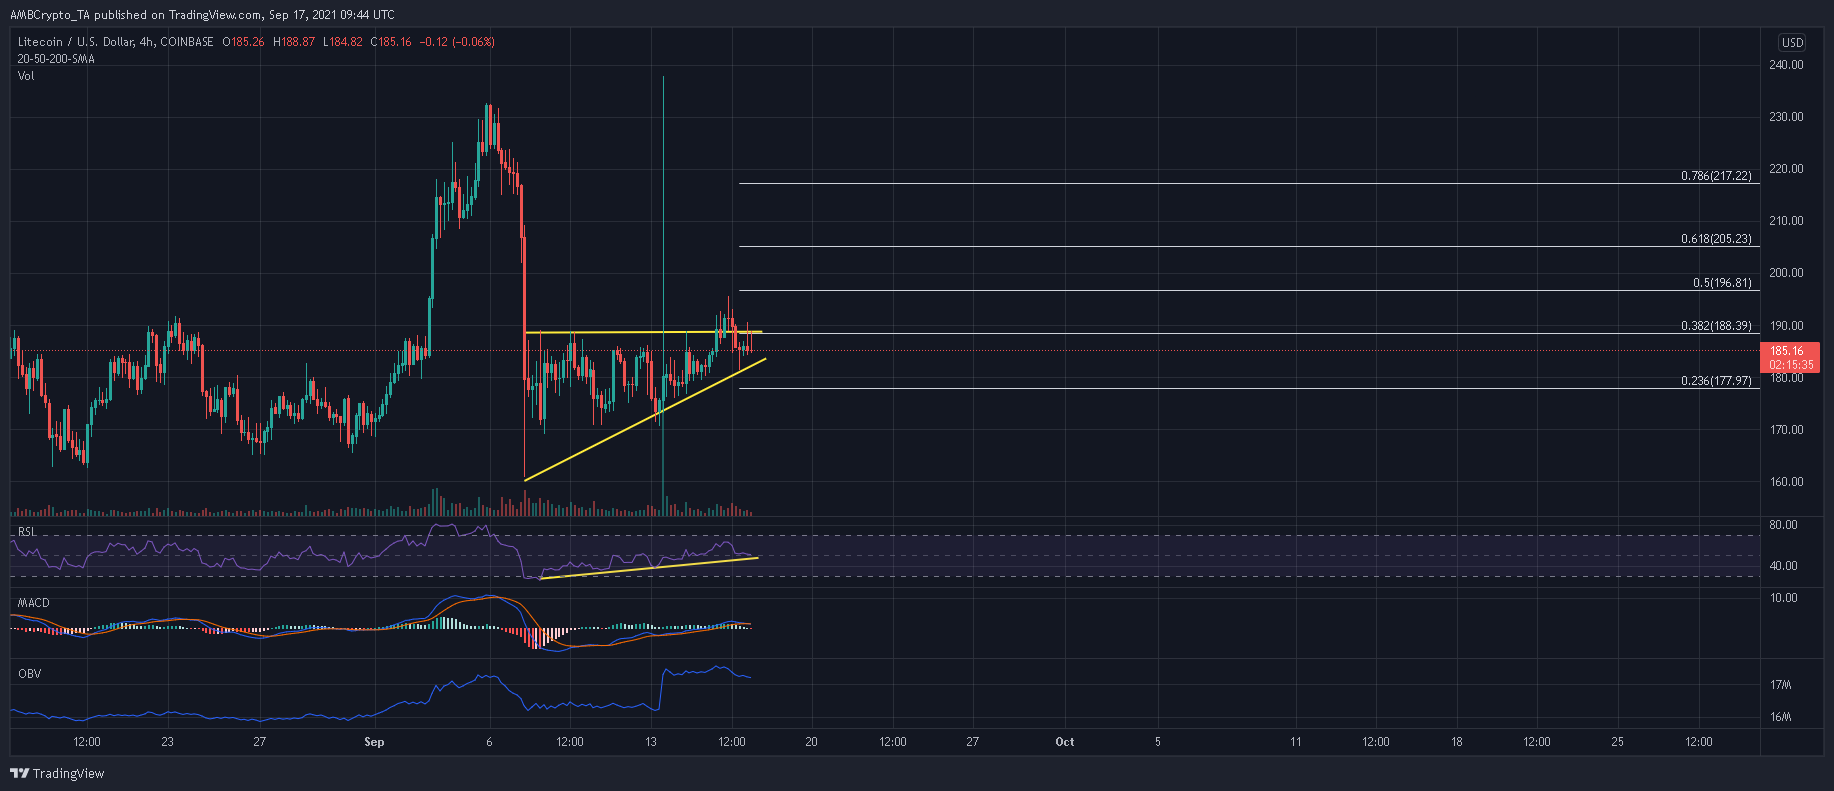
LTC’s ascending triangle was taking shape after the prices fell to a low of $160 on 7 September. Now, an early breakout or ‘fakeout’ did take place on 15 September, but since then, the price has moved back within the pattern due to weak upwards pressure.
To confirm a positive outcome, LTC needs to close above the 38.2% Fibonacci level on strong volumes. From there, the 50% and 61.8% Fibonacci levels would be targeted.
To negate this thesis, LTC would first need to pierce below the 23.6% Fibonacci level and form a lower low below $170.6.
Reasoning
While a fakeout was observed, it was evident that buyers have been gradually picking up momentum. The RSI formed lower highs over the past week and a half, indicative of a strengthening bullish trend. This was also noticeable on the On Balance Volume.
The index was trading at levels seen prior to the flash crash, when LTC formed a near 4-month high at $232.4. Finally, the MACD noted a recovery above the half-line. However, there were some short-term challenges.
The index was close to a bearish crossover and threatened to slip back into bearish territory. In such a case, expect LTC to from a higher low and maintain ground within the pattern.
Conclusion
LTC’s near-term outlook seemed positive due to the formation of an ascending triangle. When a breakout is triggered, the price can be expected to topple the 50% and 61.8% Fibonacci levels.
However, there are some short-term risks. If the price fails to rise above the upper trendline over the next 24 hours, LTC would likely form a higher low and trade within the boundaries of its bullish pattern.


