Litecoin, Zilliqa, ApeCoin Price Analysis: 31 March

Litecoin was trading within a rising channel and had good support at the $126 and $128 levels. Zilliqa could post a pullback in the coming hours or next couple of days after a week of up-only, while ApeCoin slid back beneath the range it attempted to break out of.
Litecoin (LTC)
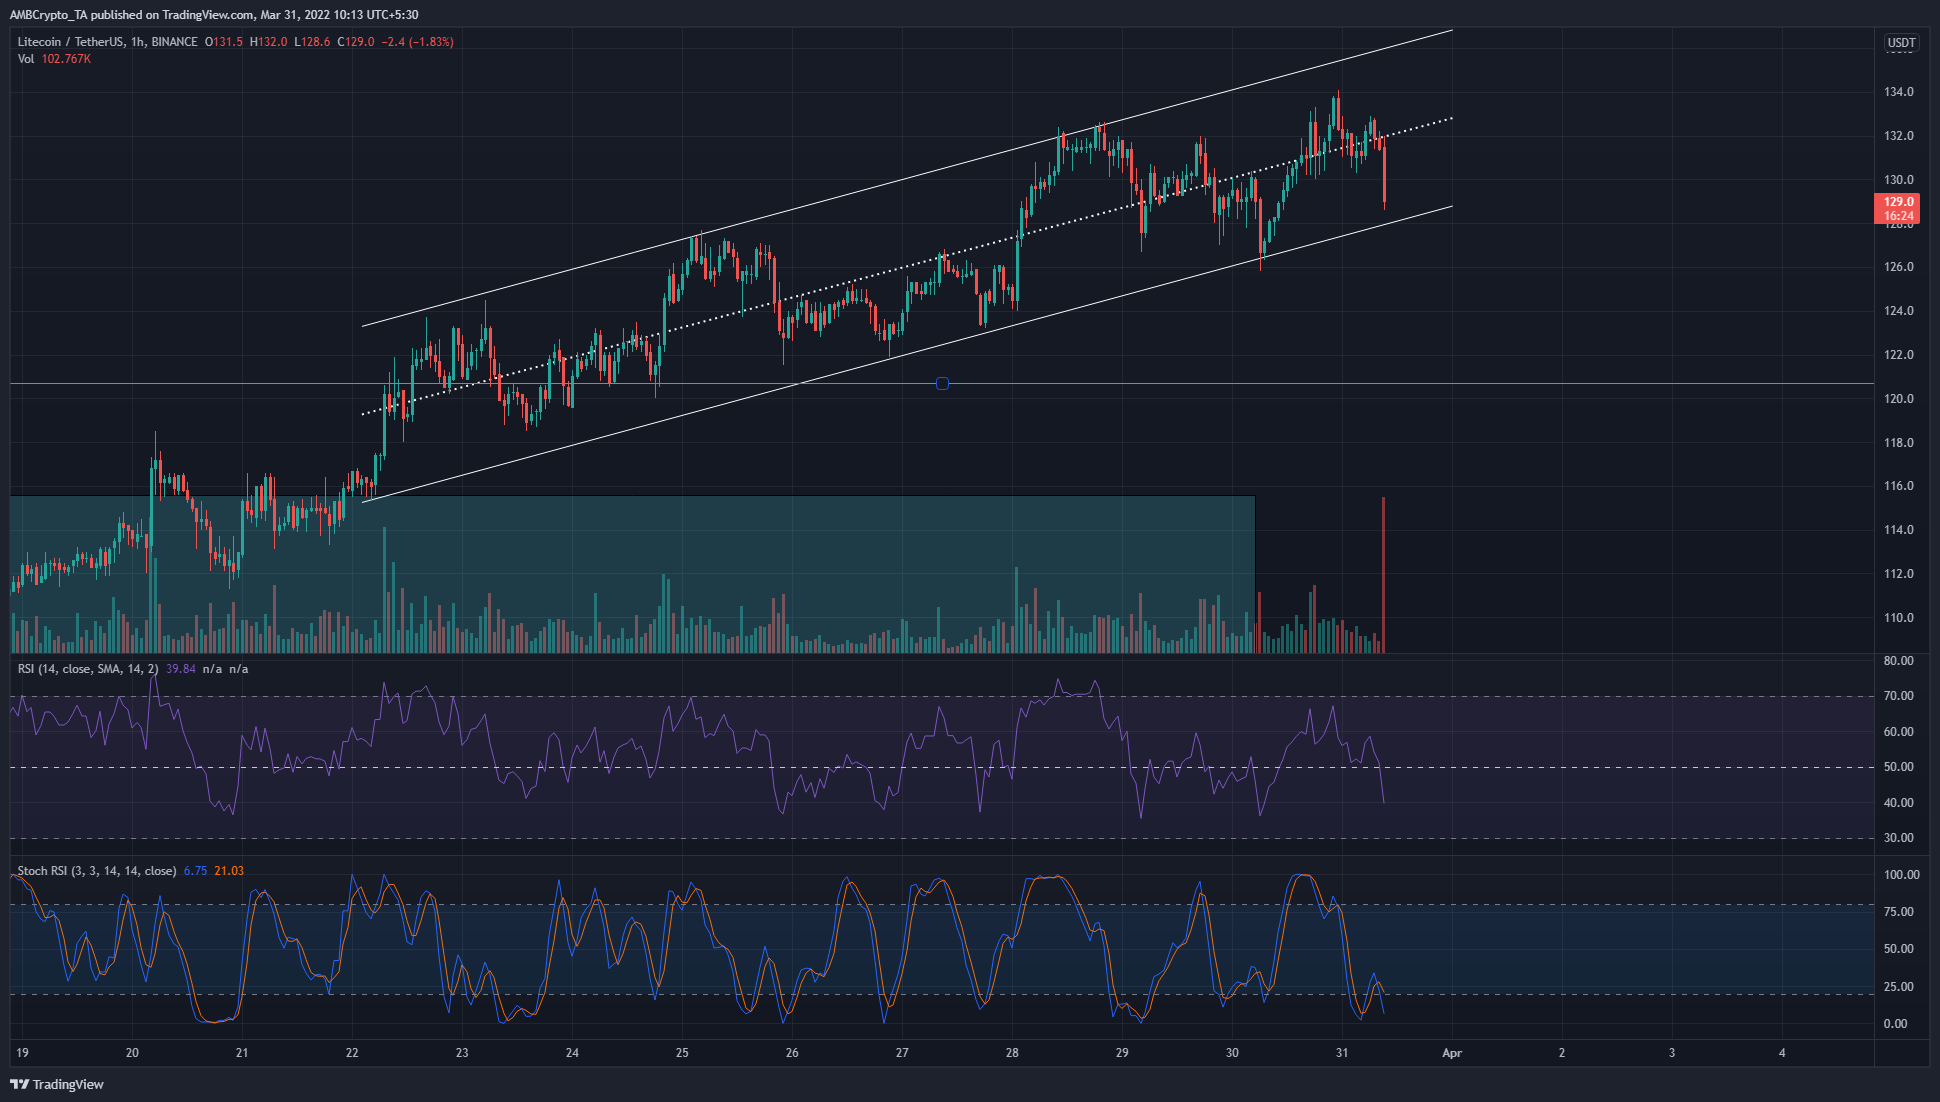
Litecoin has been trading within an ascending channel over the past ten days. At the time of writing, the RSI dived beneath the neutral 50 line even as LTC plunged below the $131 mark and the mid-point of this channel.
The most recent trading session prior to press time had extraordinary trading volume, and $128 and $126 are levels to watch out for in the near term. The Stochastic RSI was oversold. A drop beneath $128 and $126 could see LTC seek support at $118-$120.
Zilliqa (ZIL)
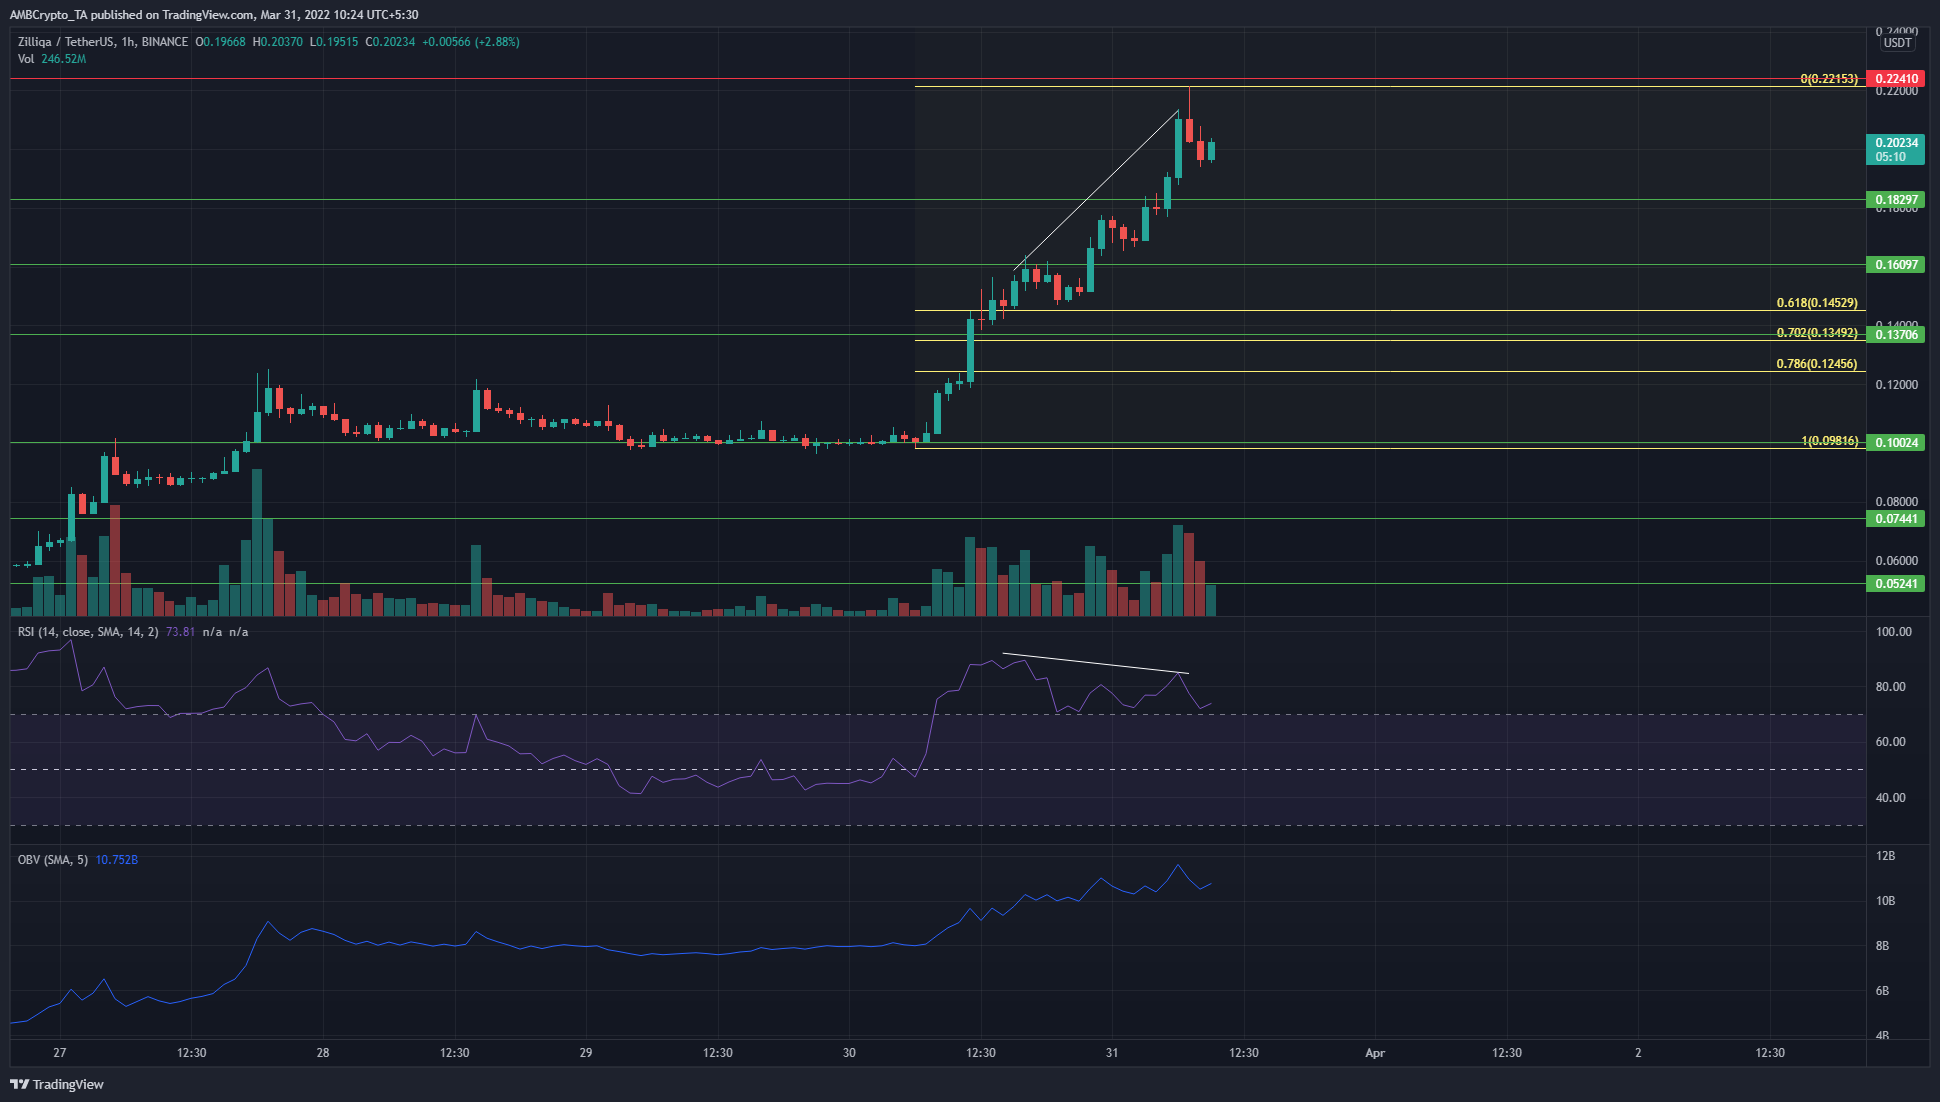
ZIL has been strongly bullish in the past week and has gained nearly 350% in a week. In the past few hours, a bearish divergence between the price and momentum (RSI) was emerging. The price made higher highs while the RSI made lower highs. This could see ZIL dip to $0.182. The Fibonacci retracement levels also marked out the $0.125-$0.145 area as a demand zone.
The OBV has been steadily rising, and unless this changes, tests of support levels could offer buying opportunities. To the upside, a longer-term resistance level at $0.224 would need to be broken.
ApeCoin (APE)
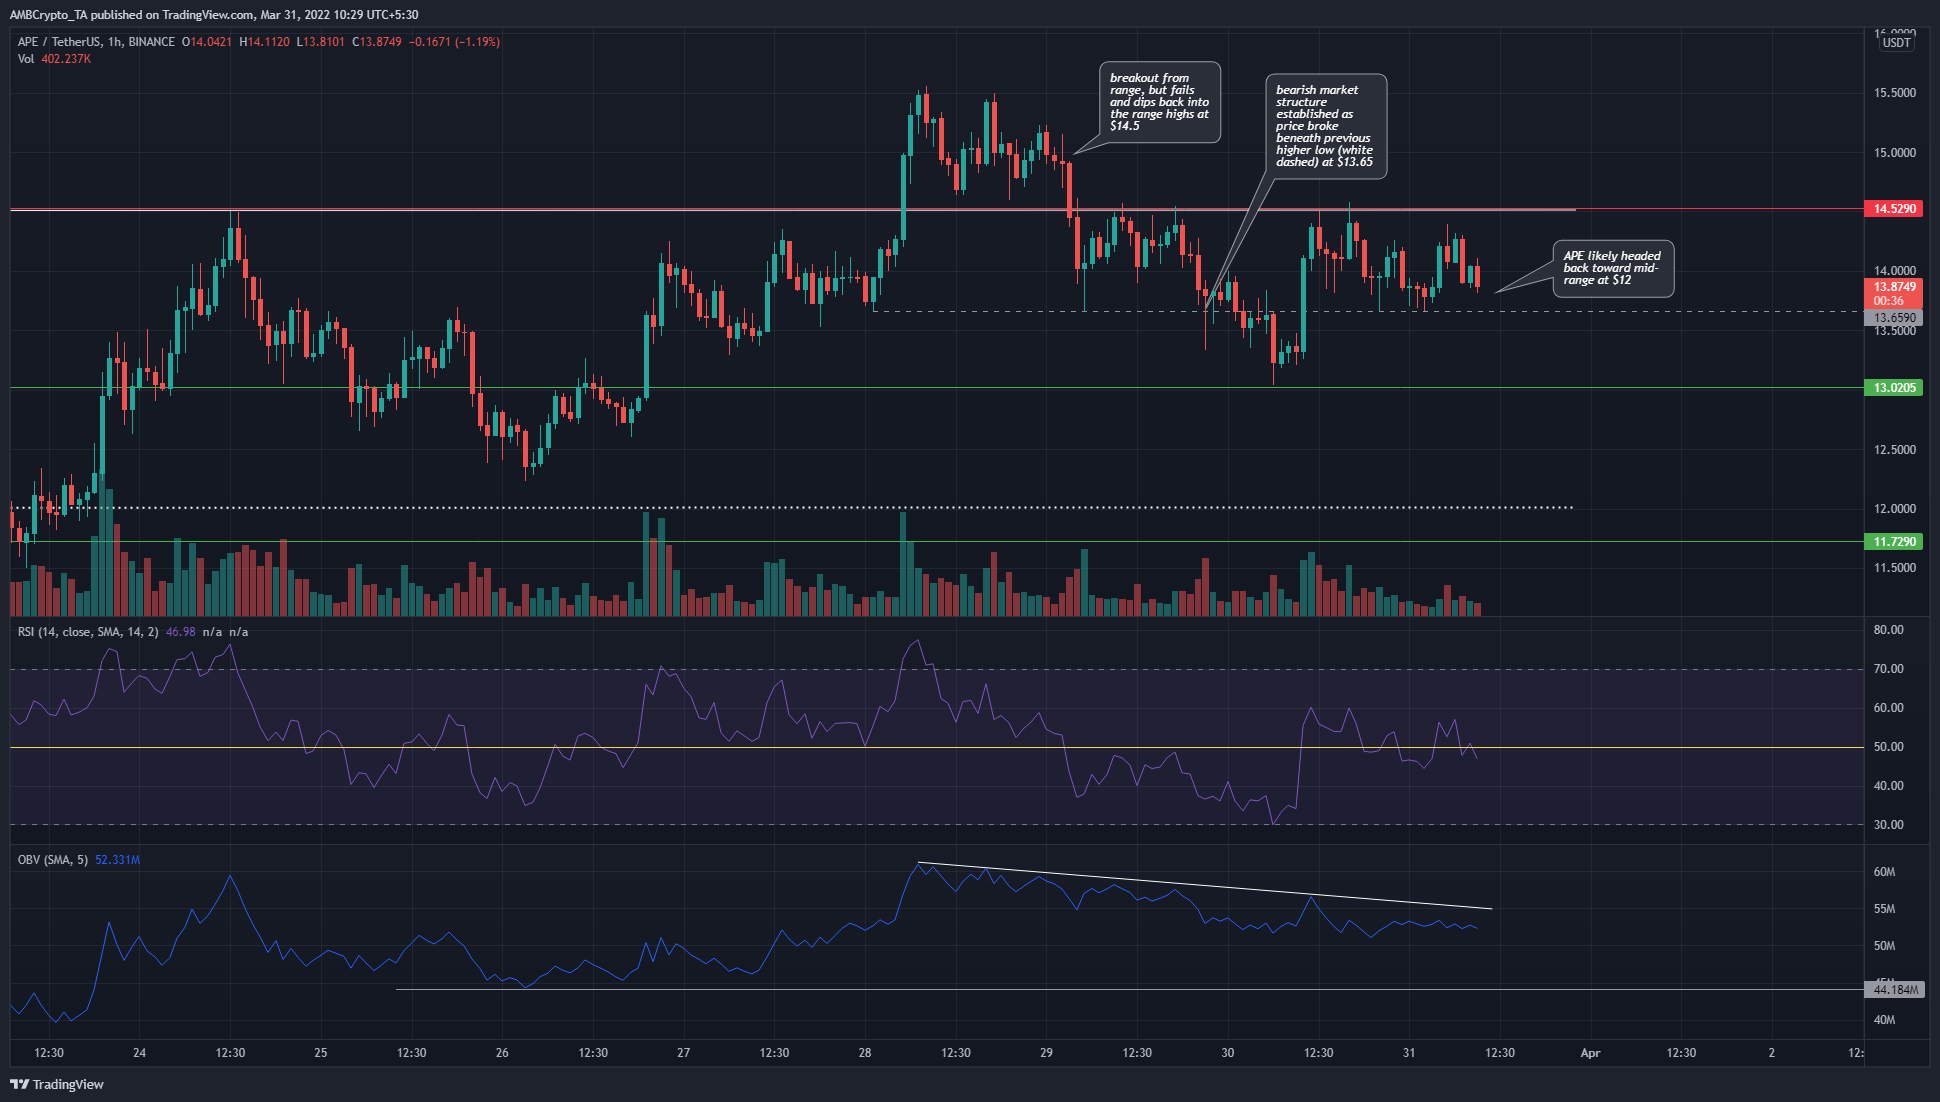
ApeCoin appeared to break out of a range (white) from $9.5 to $14.5 a couple of days ago. However, the breakout failed due to a lack of demand, as seen on the OBV. The price was unable to register a higher high after the breakout. Instead, a flip from a bullish to a bearish market structure was witnessed when the price dropped below $13.65 to test support at $13.
At the time of writing, the short-term market structure was bearish, and considering the rejection from the range highs in the past couple of days it was likely that the price would seek the mid-point of the range once again. The RSI stood at 47 and if it closes a session below 40, the likelihood of a move down would increase.


