Litecoin’s breach of this level might dictate when it enters recovery phase

Disclaimer: The findings of the following analysis are the sole opinions of the writer and should not be considered investment advice
Litecoin’s (LTC) previous rally saw remarkable gains that halted at the $280-mark. This level was near the 61.8% Fibonacci resistance. Since then, LTC has withdrawn inside a falling wedge (yellow) on its daily chart for the last 12 weeks.
Now, the falling wedge breakout candle needed a compelling close above its trendline resistance (white) or 50 SMA to confirm a possible recovery towards the $145-mark. On the flip side, any fall below the white trendline would affirm a hidden bearish divergence on its daily chart.
At press time, LTC was trading at $129.76, up by 3.58% in the last 24 hours.
Litecoin Daily Chart

The buyers stepped in at the 13-month-long support near $106. Thus, the altcoin registered an over 33% ROI in just the last 16 days from its 13-month low on 22 January. LTC’s bulls quickly took advantage of the overall perception to initiate a breakout candlestick on 7 February from its long-term falling wedge.
As it endeavored to recover its previous sell-off loss, it found a close above its 20 SMA (red). However, it becomes crucial to observe the gap between the 20 SMA and 50 SMA that failed to improve in the last 18 days. This reading suggested that the bulls had not yet assumed a strong influence.
The $133-level becomes very important for the buyers to reclaim before being in a position to swiftly test the $145-mark resistance. The $133-level also coincided with the trendline resistance (white) and the 50 SMA.
Rationale
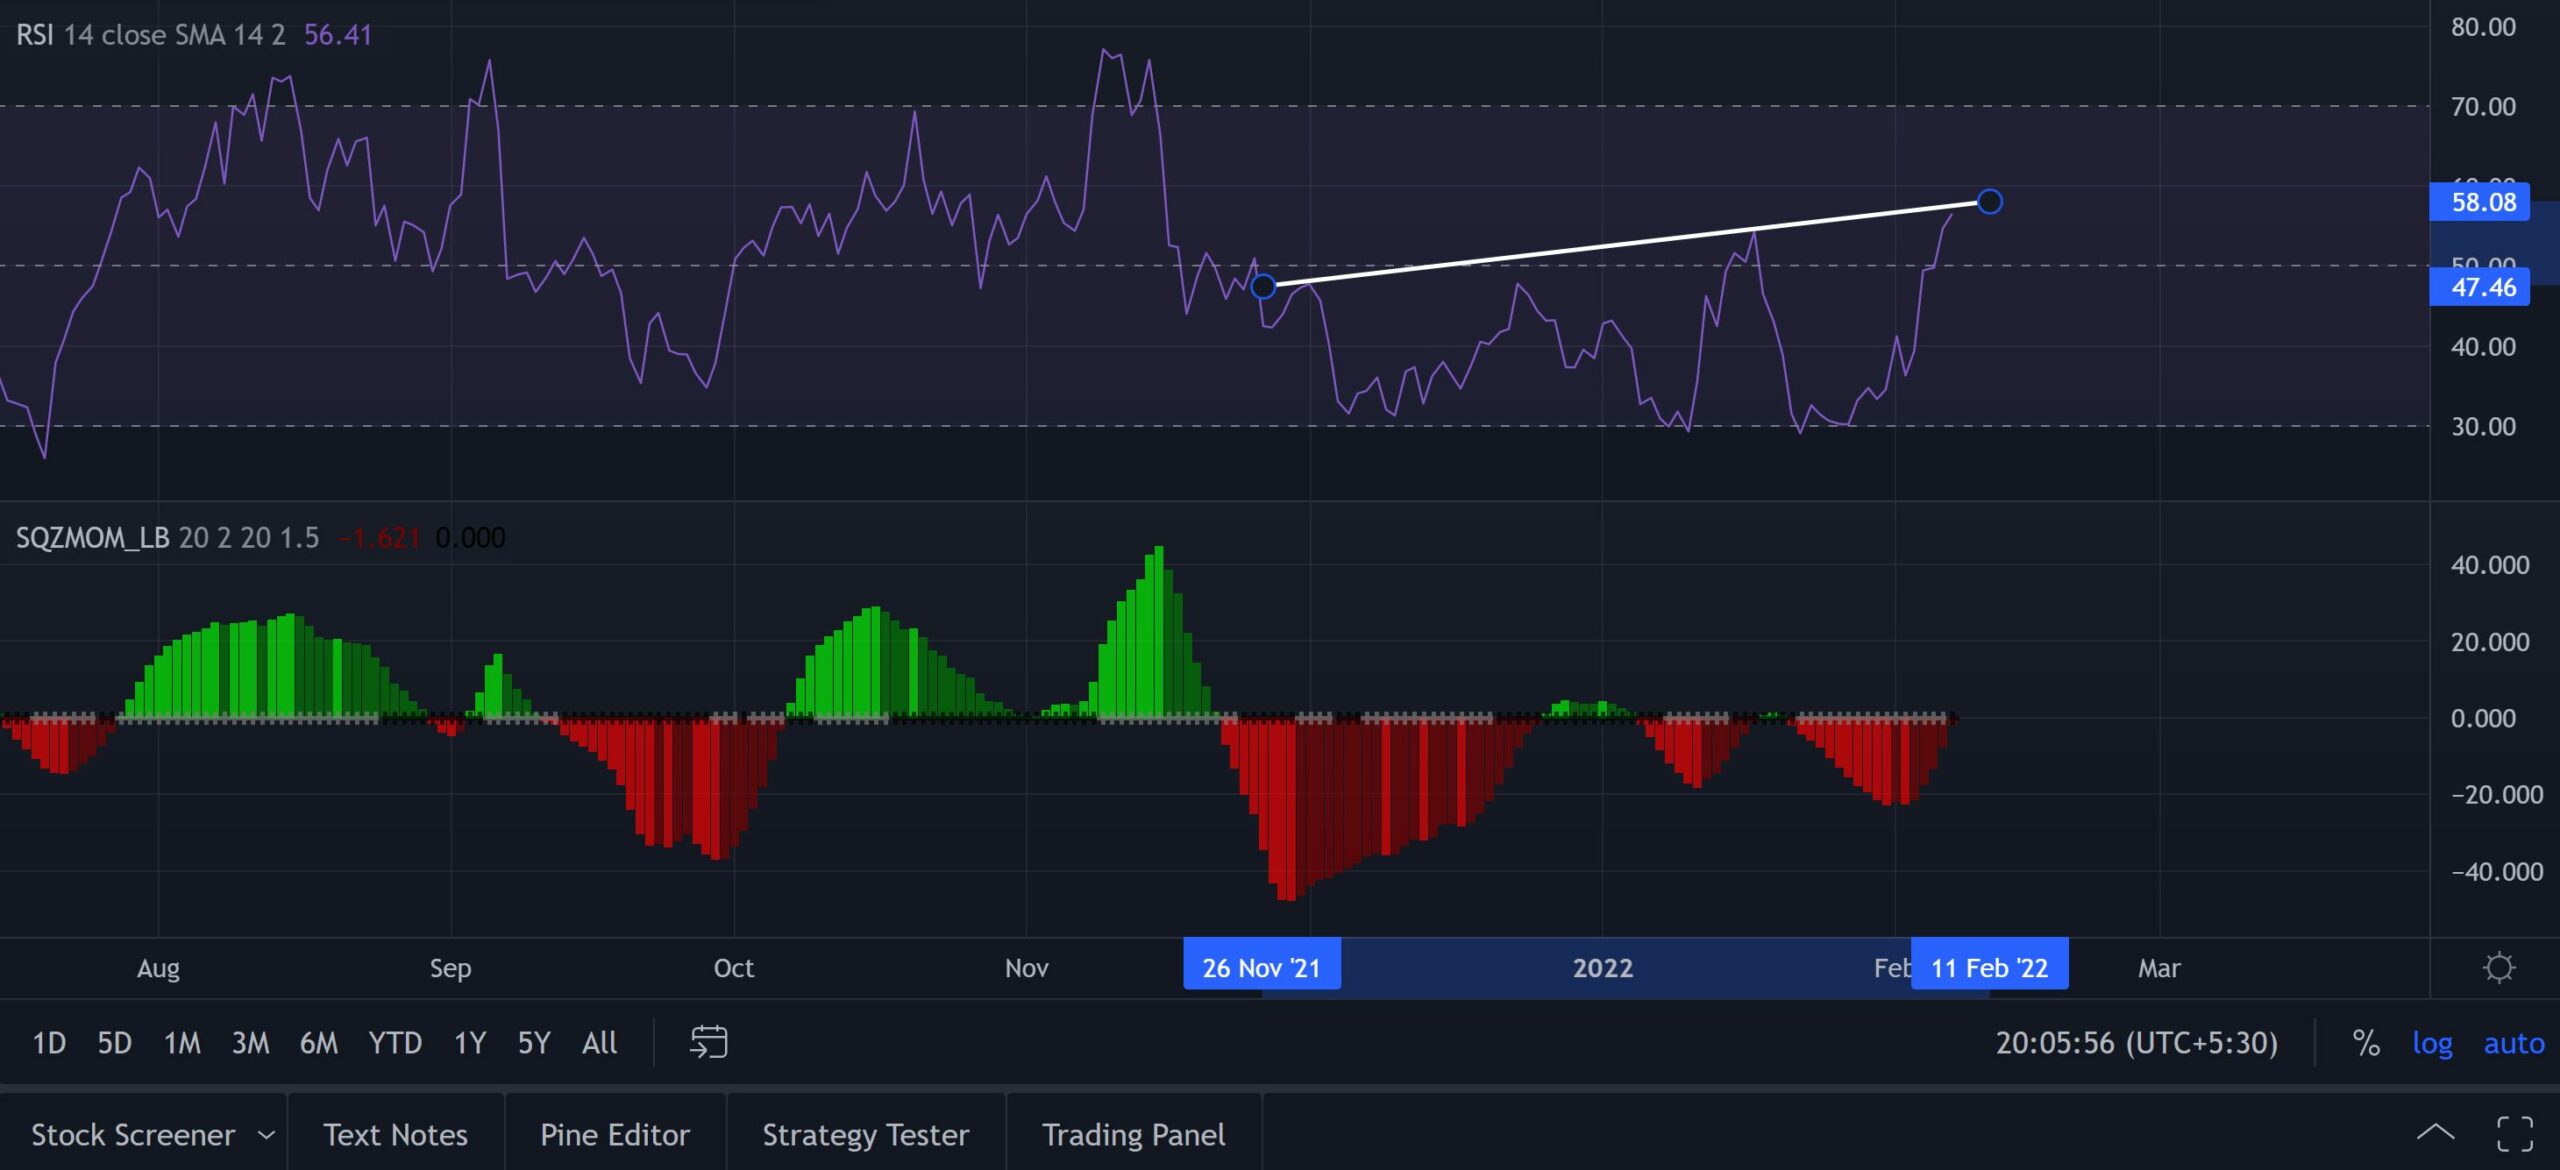
The RSI rapidly recovered and found a close above the equilibrium. However, it showed slowing signs from its trendline resistance (white). Any reversal from this level would form a bearish divergence with price and thus would slim the chances of a sustained breakout. A close above this line would open up a strong recovery possibility.
Besides, the Squeeze Momentum Indicator now flashed black dots, hinting at a low volatility phase. So, the bulls need to accelerate their thrust by ramping up volumes to make this breakout profitable.
Conclusion
The bulls need to watch out for a close above the $133-level before assuming a possible retest of the $145-mark. While LTC shares a 92% 30-day correlation with the king coin, a close watch on Bitcoin’s movement would be imperative to not make a call only based on the standalone technicals of the alt.


