- Litecoin outperformed Bitcoin, driven by liquidations, but risks remain due to market volatility
- Analysts urge caution as LTC faces key support challenges and ongoing price fluctuations
Litecoin [LTC] recently showed a slight edge over Bitcoin [BTC] in the short term, with some bearish positions being liquidated in the process. This uptick in LTC’s price has sparked optimism among traders, but analysts are urging caution.
Despite the rally, the market remains volatile, making risk management essential.
LTC’s short-term performance – Liquidations fuel the rally, but caution is required
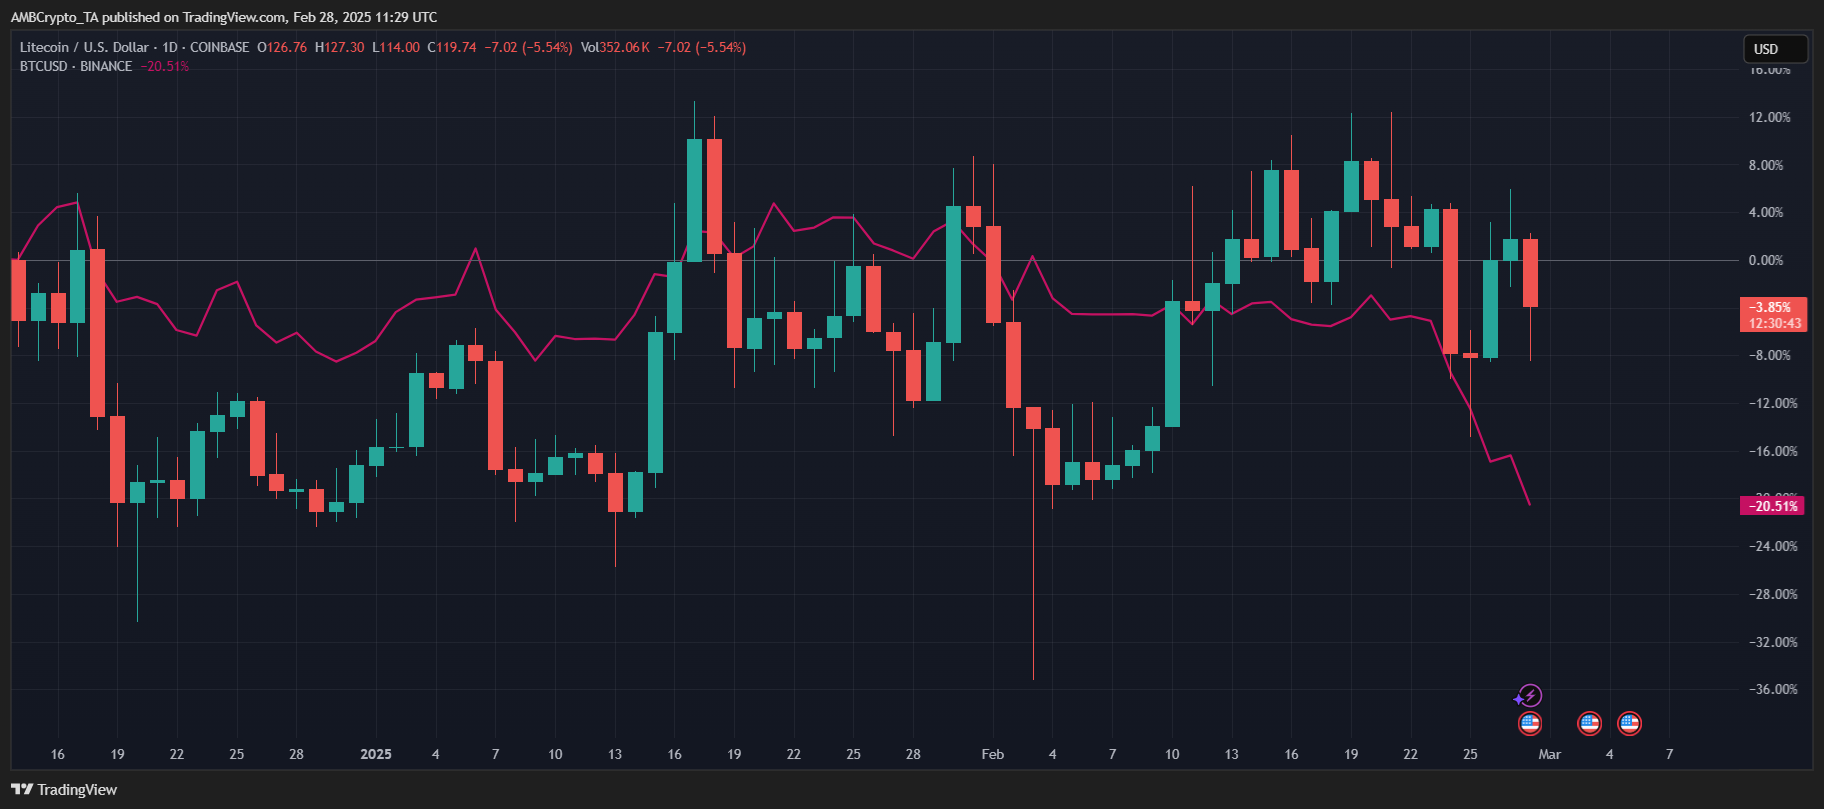
Litecoin has seen a 5.54% decline in the last 24 hours, trading at $119.74 on the charts following a high of $127.30. Despite this pullback, however, LTC outperformed Bitcoin in the short term. The liquidation of bearish positions likely contributed to a temporary price boost before the retracement.
Source: TradingView
Data indicated that while LTC recorded a strong rally in mid-February, rejection at key resistance hinted at profit-taking and market uncertainty.
Meanwhile, BTC saw a 20.51% decline, before recovering, reflecting broader market weakness. Analysts have thus emphasized the importance of stop-loss levels, as volatility remains high with key LTC support at $114 and $110.
Litecoin market analysis
Recent analysis also highlighted a dynamic market landscape.
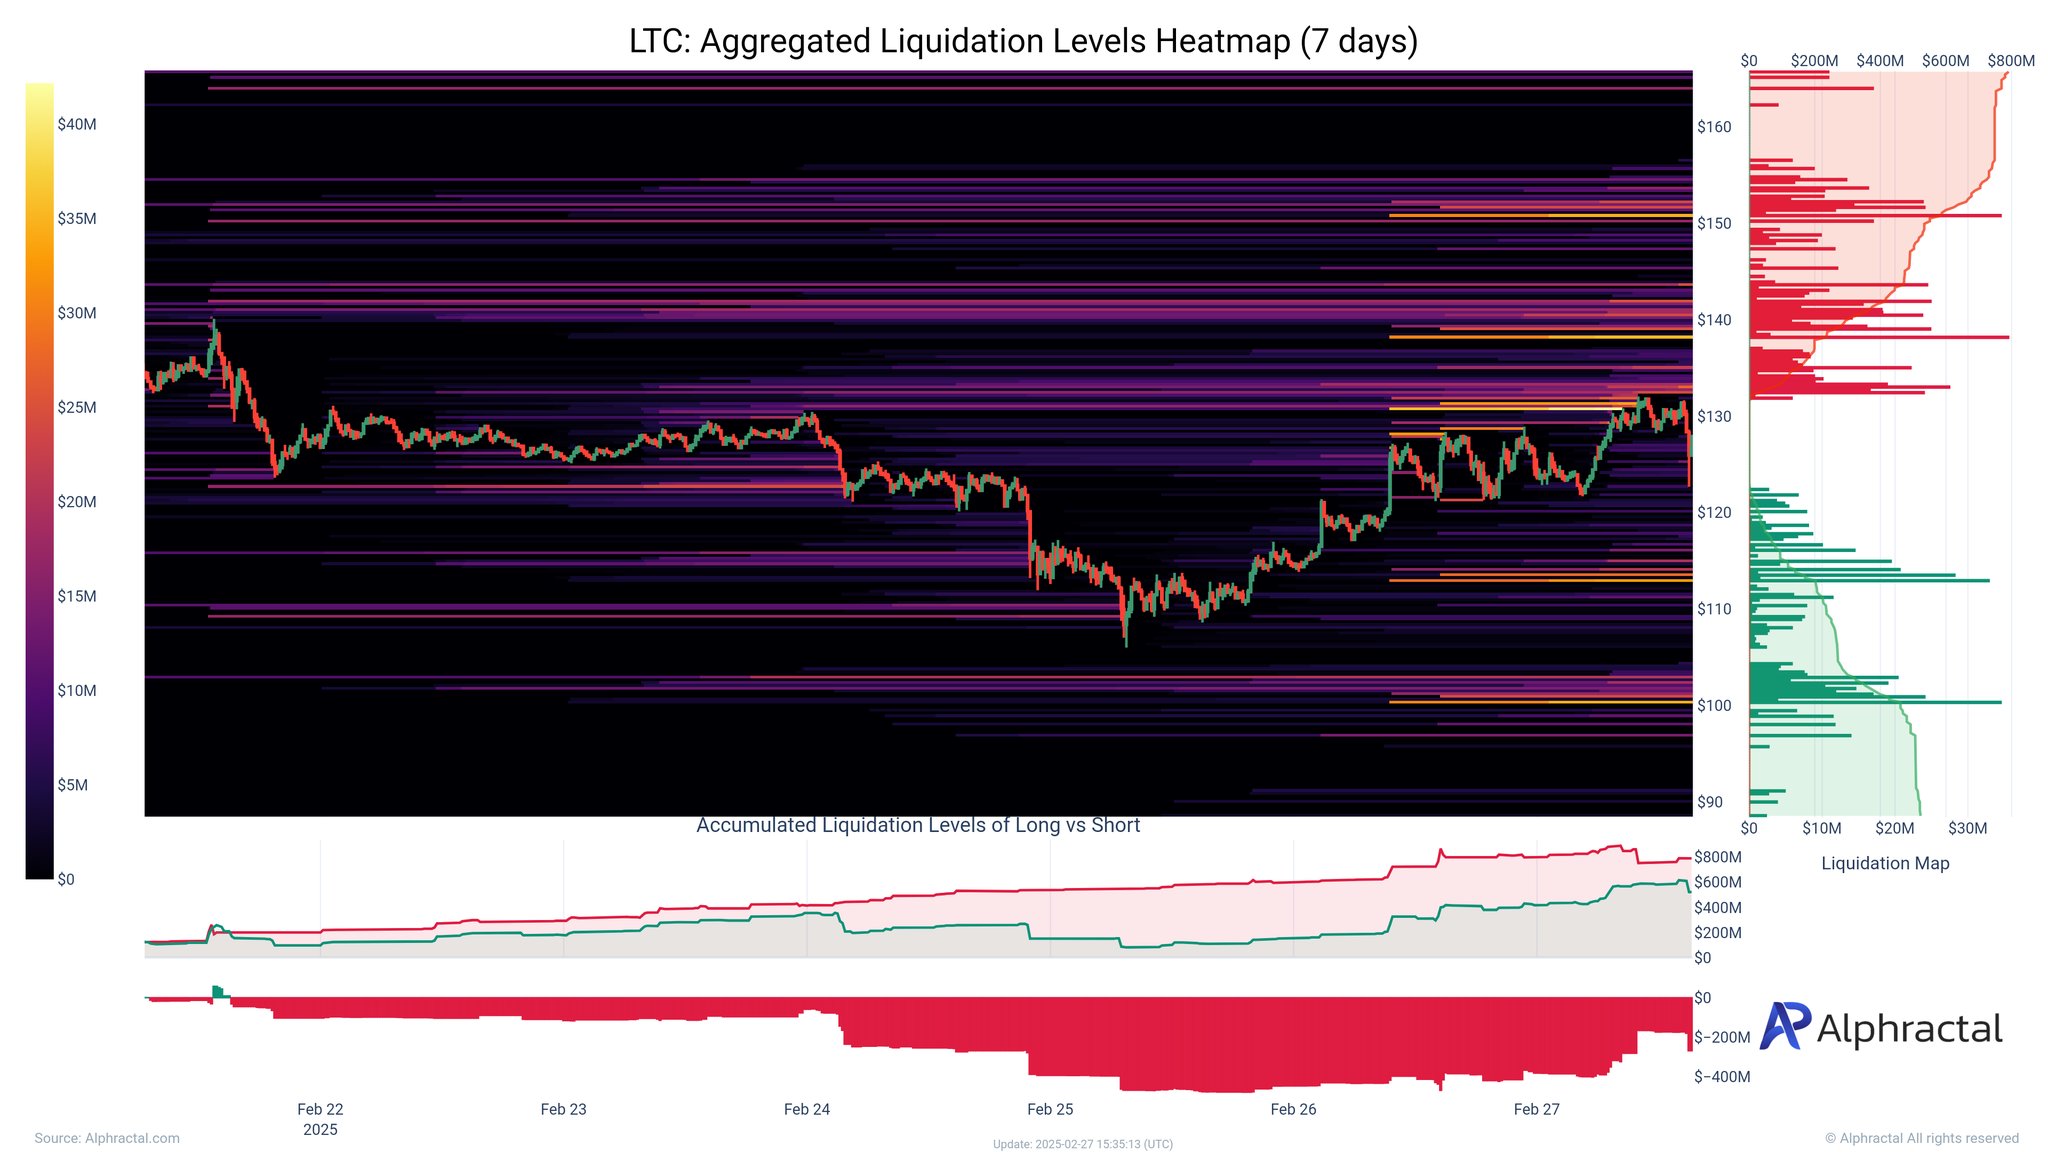
A seven-day liquidation heatmap revealed significant activity at key levels – Strong short liquidations near $130 resistance and long liquidations near $110 support. The cluster of short liquidations above $130 suggested that bearish positions were squeezed as LTC attempted to rally on the charts.
Source: Alphractal
This rally was largely driven by short liquidations.
However, as LTC approaches the $110-level, long liquidations will become more pronounced, signaling potential downside risk if selling pressure increases. The overall trend also highlighted more short liquidations than longs – Reinforcing that bears were forced out during the upward move.
Source: Alphractal
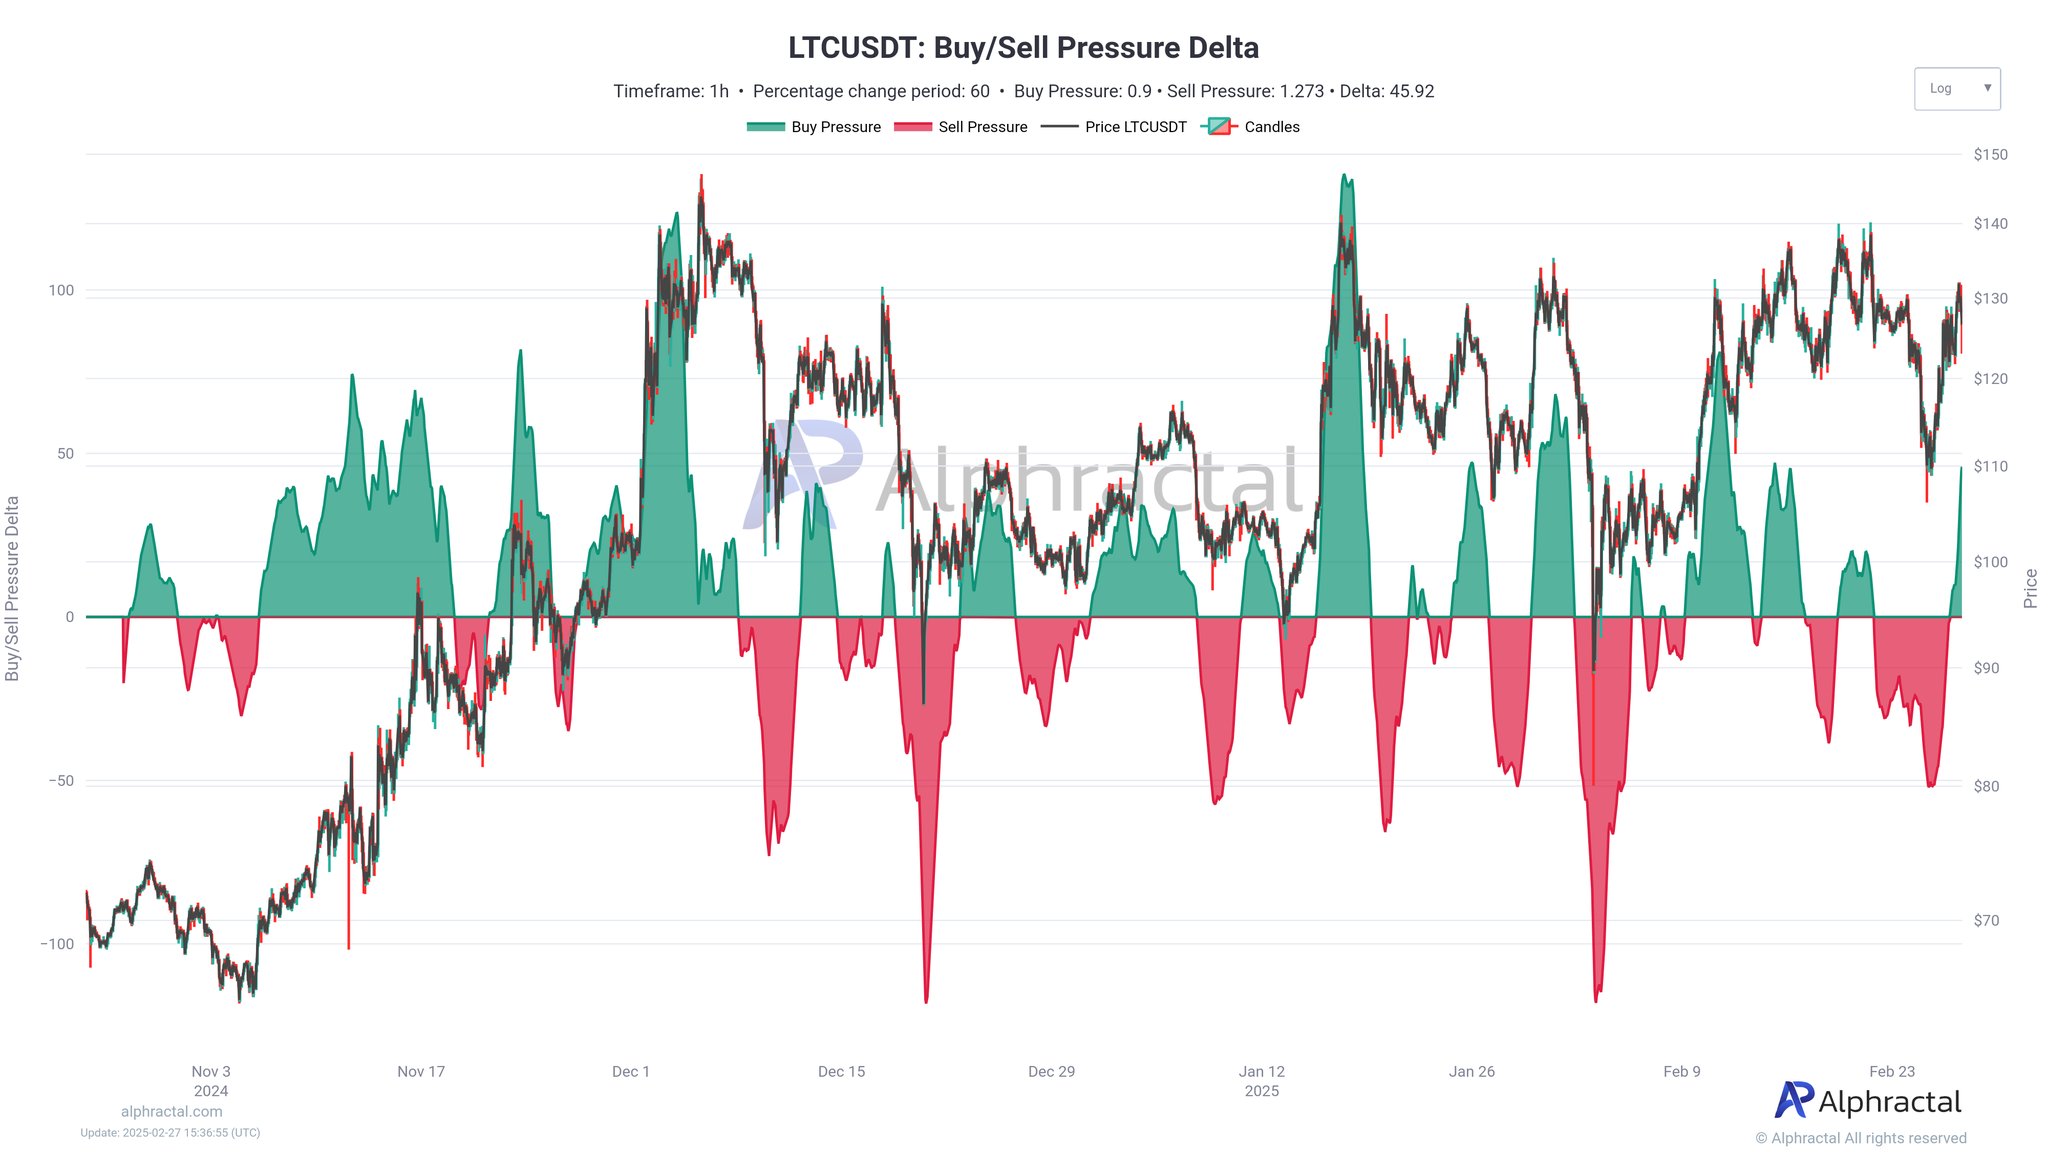
The buy and sell pressure chart underlined key moments of accumulation and distribution.
During LTC’s rally, buy-side dominance pushed the price higher. As momentum slowed, sell pressure increased, suggesting profit-taking or a shift in sentiment. Despite this, demand has remained strong near support, hinting at a potential rebound if LTC stabilizes.
Source: Alphractal
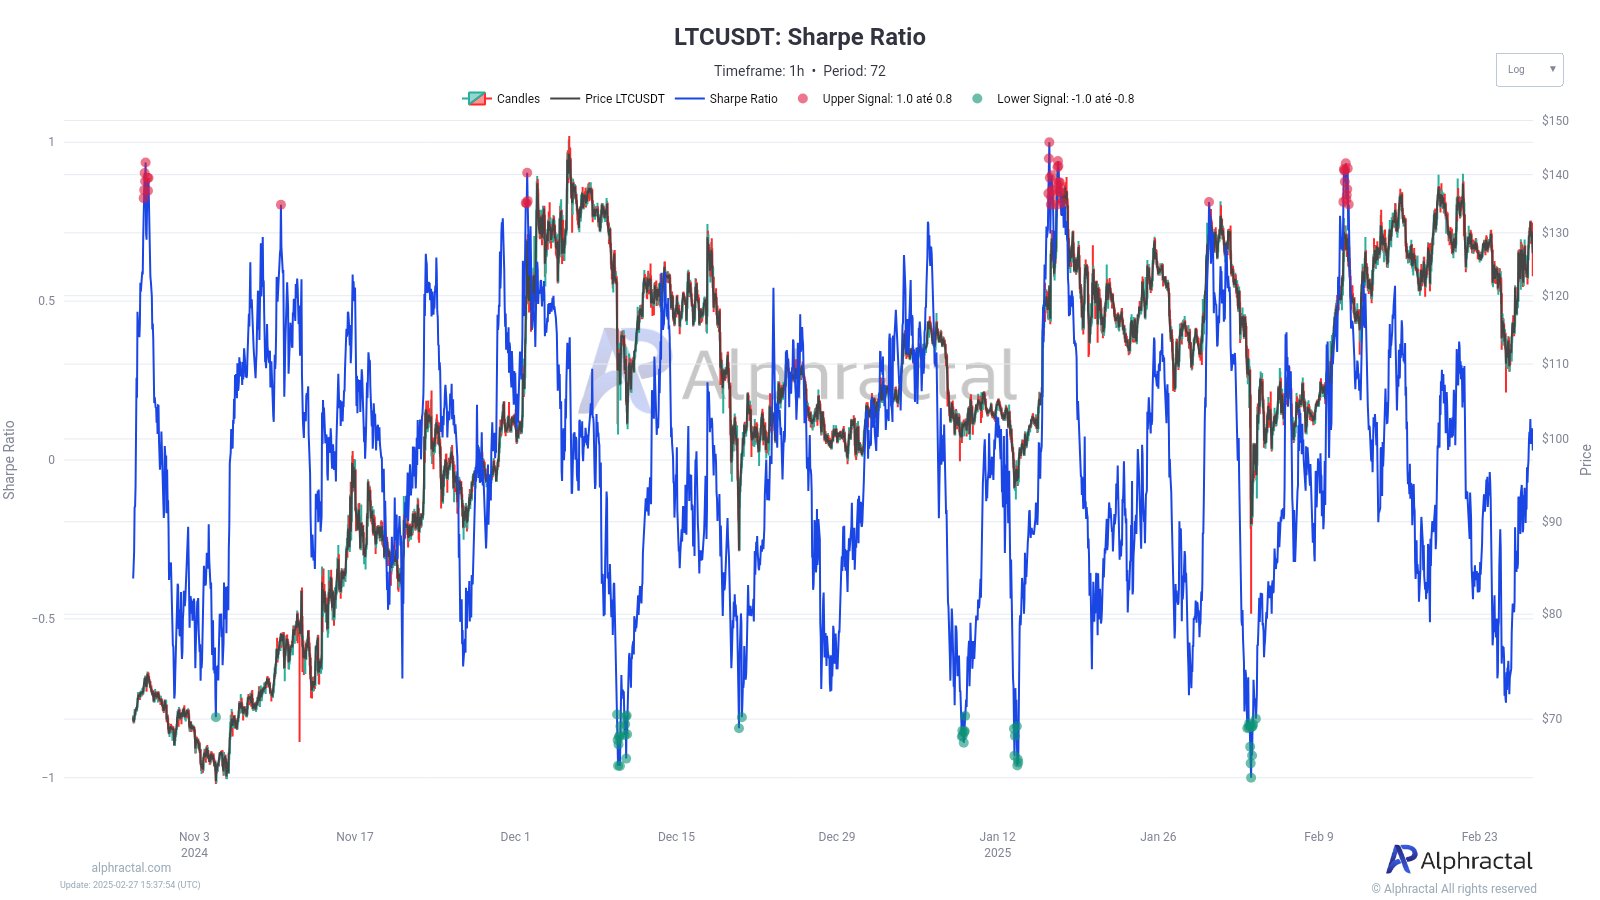
Finally, the Sharpe Ratio, with spikes above 0.8, signals overbought conditions where returns outpace risk, often leading to corrections. Conversely, dips below -0.8 indicate undervaluation, where risk outweighs potential returns.
At the time of writing, LTC’s Sharpe Ratio seemed to be rebounding from a recent low – A sign that while volatility persists, risk-adjusted returns may improve in the near future.