Looking into Bitcoin’s organic growth, as it lies low after recent euphoria

October 20 finally marked the much-awaited Bitcoin all-time high, as BTC blasted to $67K. Market-wide euphoria and FOMO, however, sent Bitcoin price into a kind of consolidation stage. Investors locked in profits following the non-stop over 50% price run that the top coin saw since the beginning of this month.
Last week, the BTC weekly closed above a historical major resistance area. This week, after the king coin’s price ATH, BTC may be dipping towards the same area. Only, this time there are high anticipations that BTC will turn it into a major support zone.
If the $60K support is established further, price growth and a run to $100K could be in store.
Organic growth backing BTC
While with the current consolidation, BTC is down almost 7% from its ATH, there are expectations of a further short-term fall in the last week of October. However, with prevalent signs that point towards further growth in price, BTC’s path ahead looks clear.
Notably, the Puell Multiple seems ready to make a breakout to the top. The Puell Multiple is calculated by dividing the daily issuance value of Bitcoins (in USD) by the 365-day moving average of daily issuance value.
Values greater than 4.0 on the metric historically signaled macro market tops, and although it reached values between 6 and 10, during early Bitcoin cycles for the past two years, it failed to make a move above 3.0.

Further, we see that a pronounced and steady trend for the outflow of BTC has finally appeared. On 22 October, an outflow of 16,845.59 BTC was recorded. The outflows are also confirmed by the Withdrawal Shutdown Index.

That being said, analysts pointed out how strong inflows for the new ProShares Bitcoin Strategy ETF show pent-up demand and quantitative traders targeting arbitrage opportunities. Bloomberg Intelligence also pointed out that we are seeing BTC on track to trade like gold.
Looking out for these levels
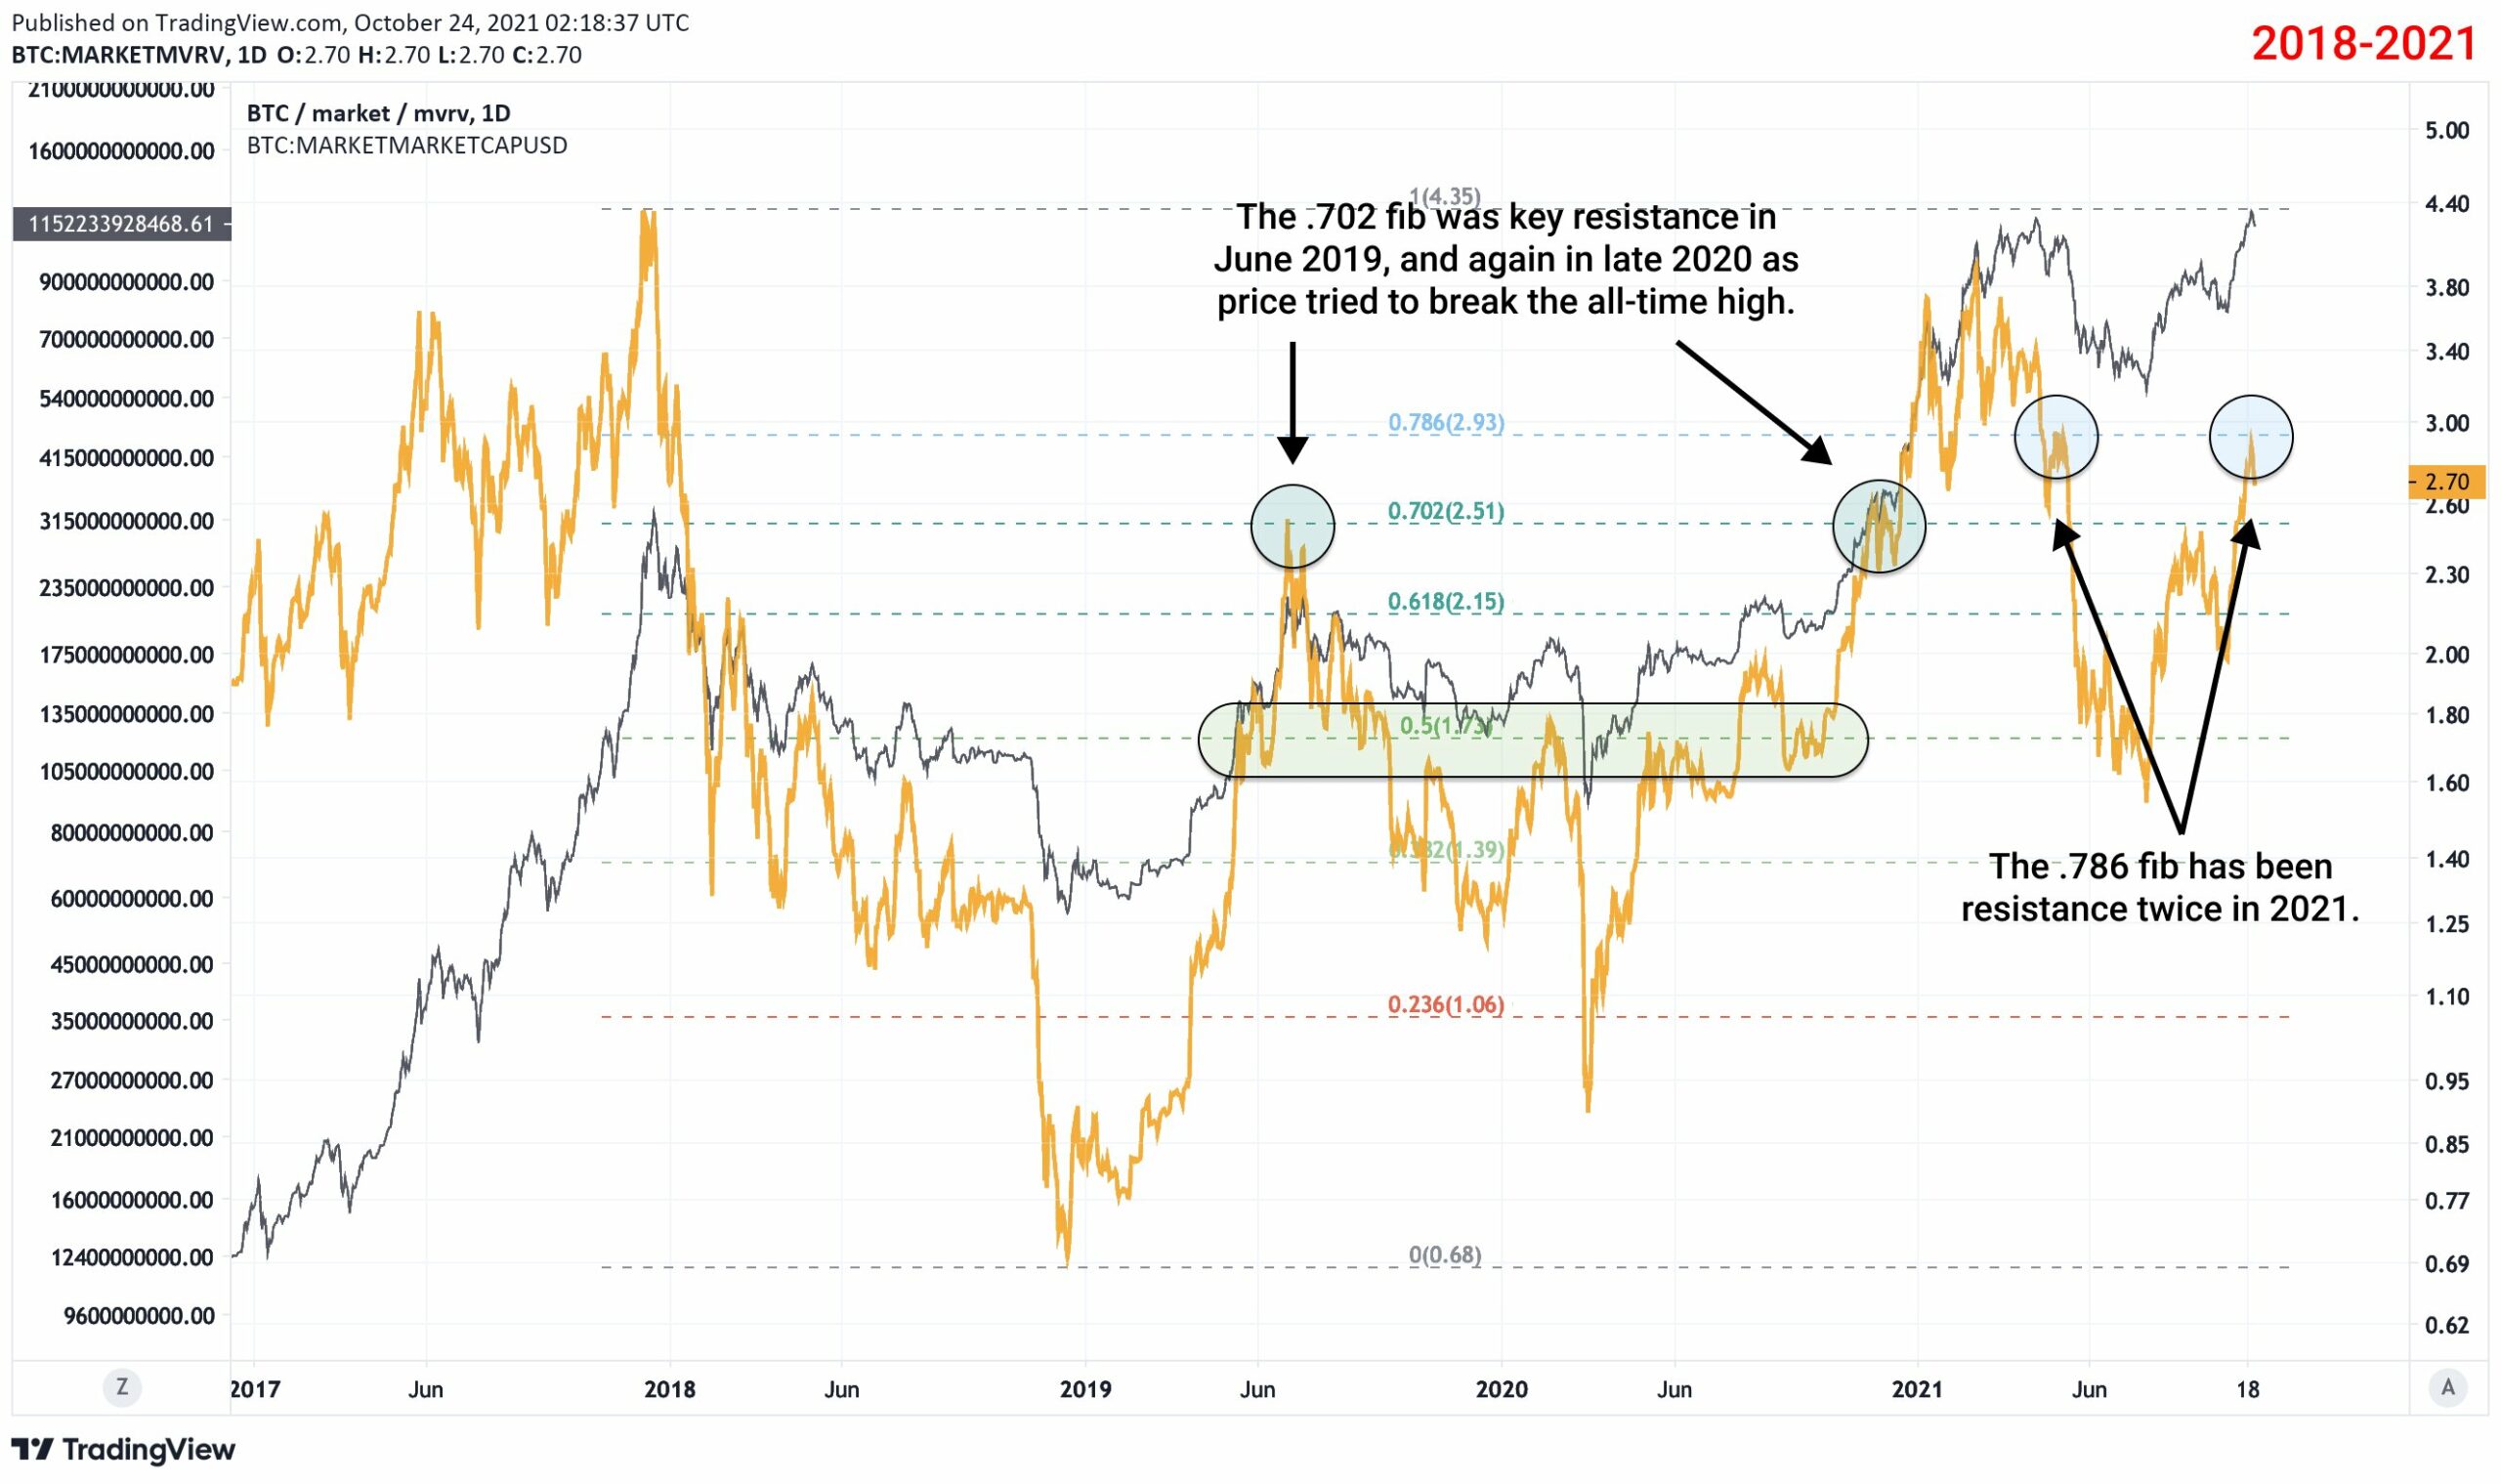
By applying Fibonacci alongside MVRV, we can see key pivots in the coming cycle. Pseudonymous analyst TXMC noted that Bitcoin is currently using old RSI resistance as new support with the Fibonacci values of 0.618, 0.702, and 0.786 as pivotal retracement levels.
June 2019 saw a tap of the 0.702 Fib level, marking the mid-cycle top. After building support near 0.5, the 0.702 level again played resistance as the price broke the all-time high. Twice in 2021, the 0.786 Fib has been resistance for MVRV, including the October pullback. Yet again, as the same levels are tested, upward momentum looks more or less confirmed.
All in all, Bitcoin’s organic growth and certain historic signs of a price push persisted even as the king coin seemed to consolidate post the ATH-fever. So if a short-term pullback is seen on Bitcoin, it would be a good buy signal for the market participants.


