LTC flips structure to bullish but why the macro trend is still bearish

Disclaimer: The findings of the following analysis are the sole opinions of the writer and should not be considered investment advice
The movement of Litecoin on the price charts has a +0.96 correlation (30-day) with the movement of Bitcoin. This meant that the bullish phases of Bitcoin would also see price appreciation for Litecoin. Yet, while Bitcoin broke out past $45k and looked to cement a floor from which to initiate a bullish run, Litecoin struggled to set a higher high.
LTC- 1D
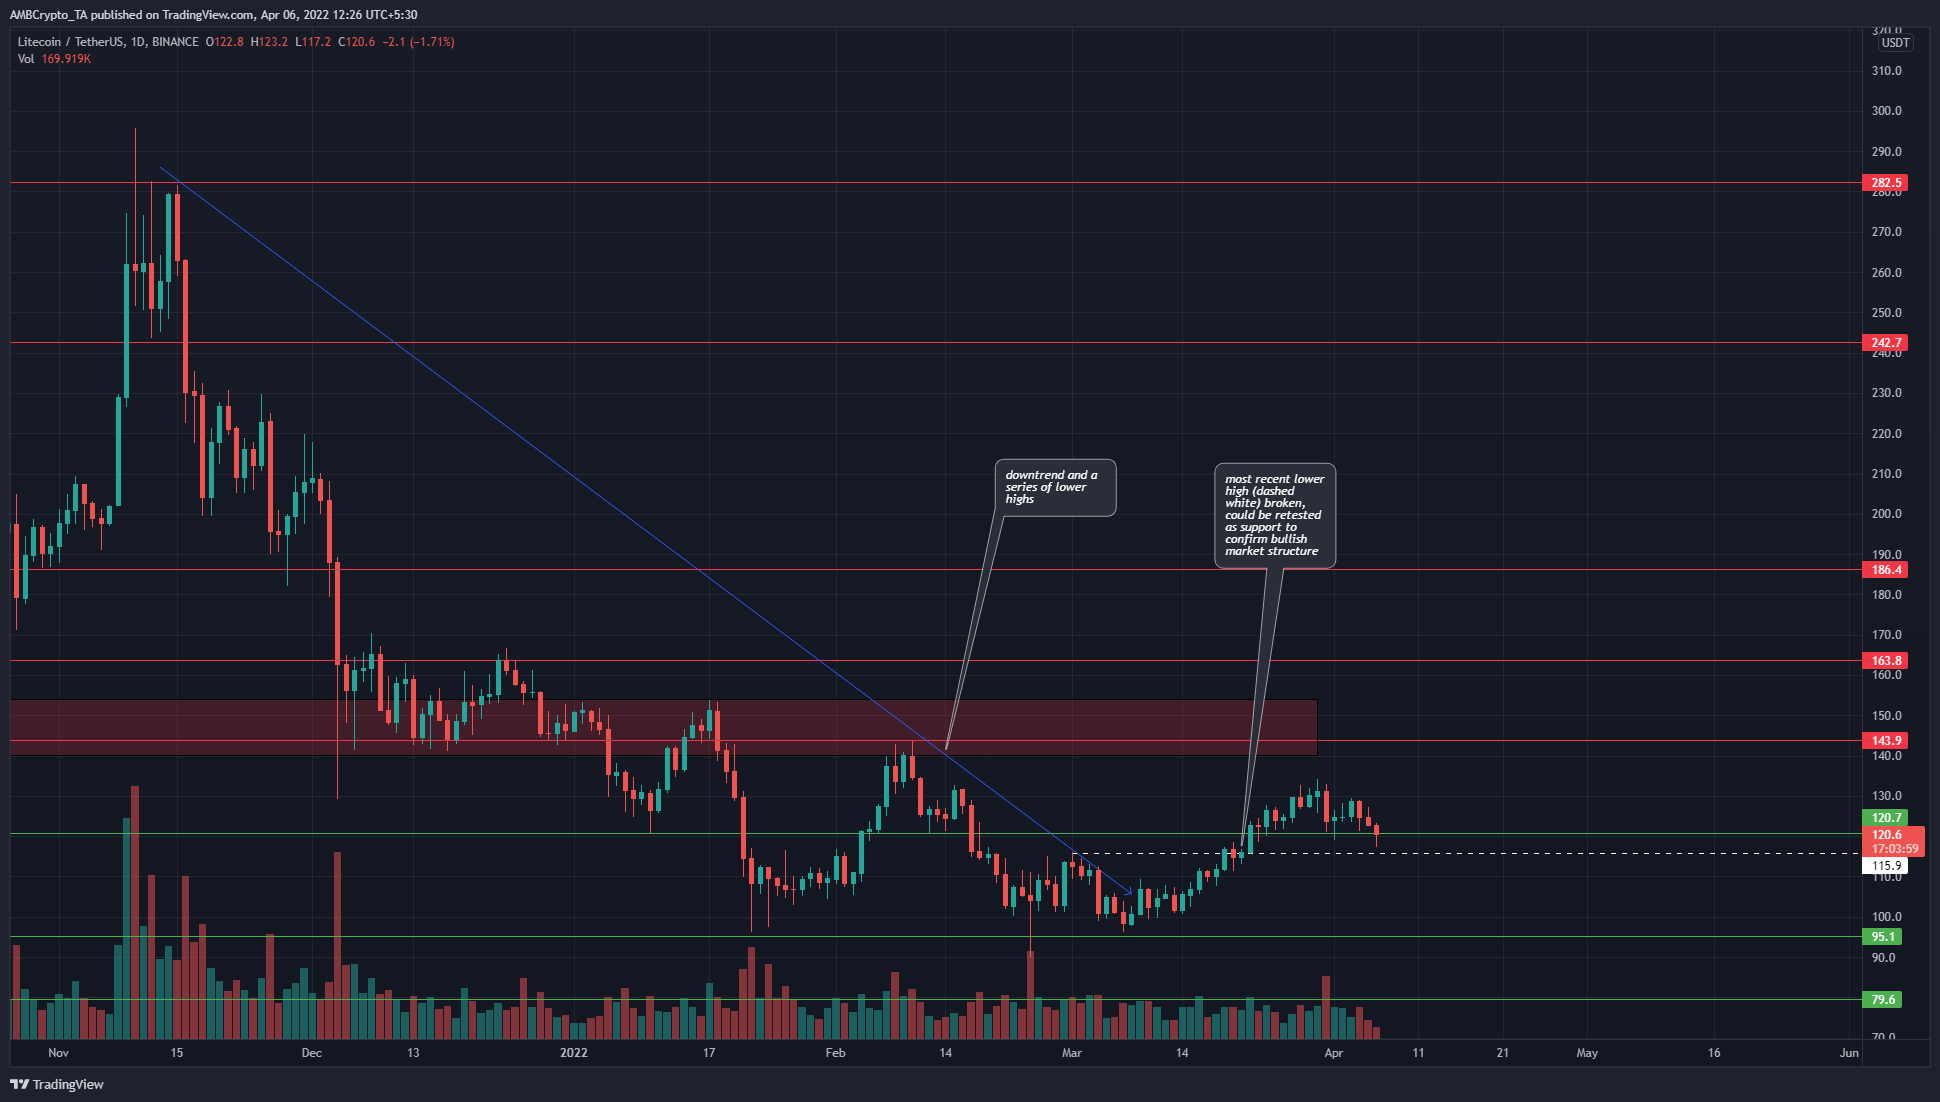
Litecoin has been on a downtrend since late November when the price dropped below $216 and retested it as resistance. However, in the past two months, LTC has found some support at $95-$100 and consolidated.
Moreover, it has been able to break past the $115.9 level (dotted white) and, at press time, was straddling the $120 level as support. Does this mean that a bullish trend has been established? Not quite yet.
Even though there has been a market structure break, the longer-term trend was still bearish. In the next few days, a run toward the $145-$150 area could materialize. However, the price would need to flip $150 from resistance to support.
Rationale
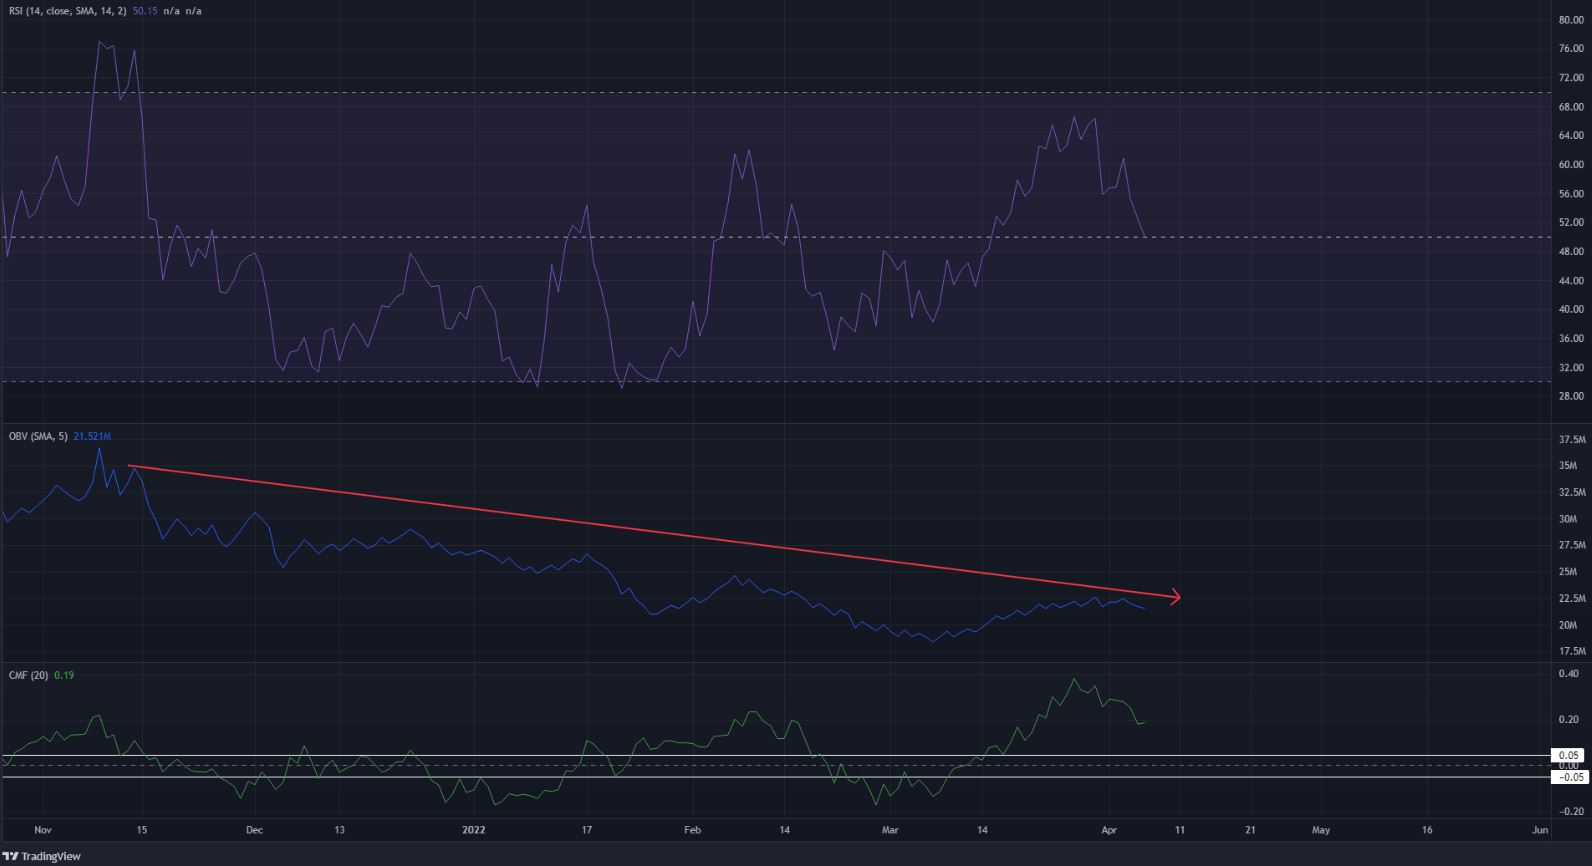
What do the indicators have to say about the trend of Litecoin? The RSI on the daily chart had made its way above the neutral 50 line to show that some bullish momentum was seen in the past two weeks. If the RSI does not head back beneath 40 and instead rises past the 60 mark again, it would mean that strong bullish momentum was present once more.
Even though the Chaikin Money Flow was well above +0.05, the OBV showed that overall, selling pressure has been greater than buying pressure. Therefore, though the month of March has seen some buying (and the OBV reflects it too), there has likely not been enough buying to shift the trend to bullish.
Conclusion
The $115-$120 area of support was likely to serve as support and LTC could move higher once more. Yet, the overall trend of bearishness has not changed a lot. The lack of significant buying volume in the past few months was apparent. Until $150 is flipped to support, LTC would likely not have a bullish outlook on the longer timeframes.


