LUNA, Cardano, and Avalanche Price Analysis: 11 May

LUNA has fallen around 84% within 72 hours following the ruckus around the stablecoin UST. UST de-pegged from the dollar and fell below $1, as low as $0.65 before recovering to $0.94 and dropping toward $0.7 once more.
Support levels don’t really appear to matter for LUNA right now as the selling pressure has been extreme. Cardano and Avalanche were also on a downtrend.
Terra (LUNA)
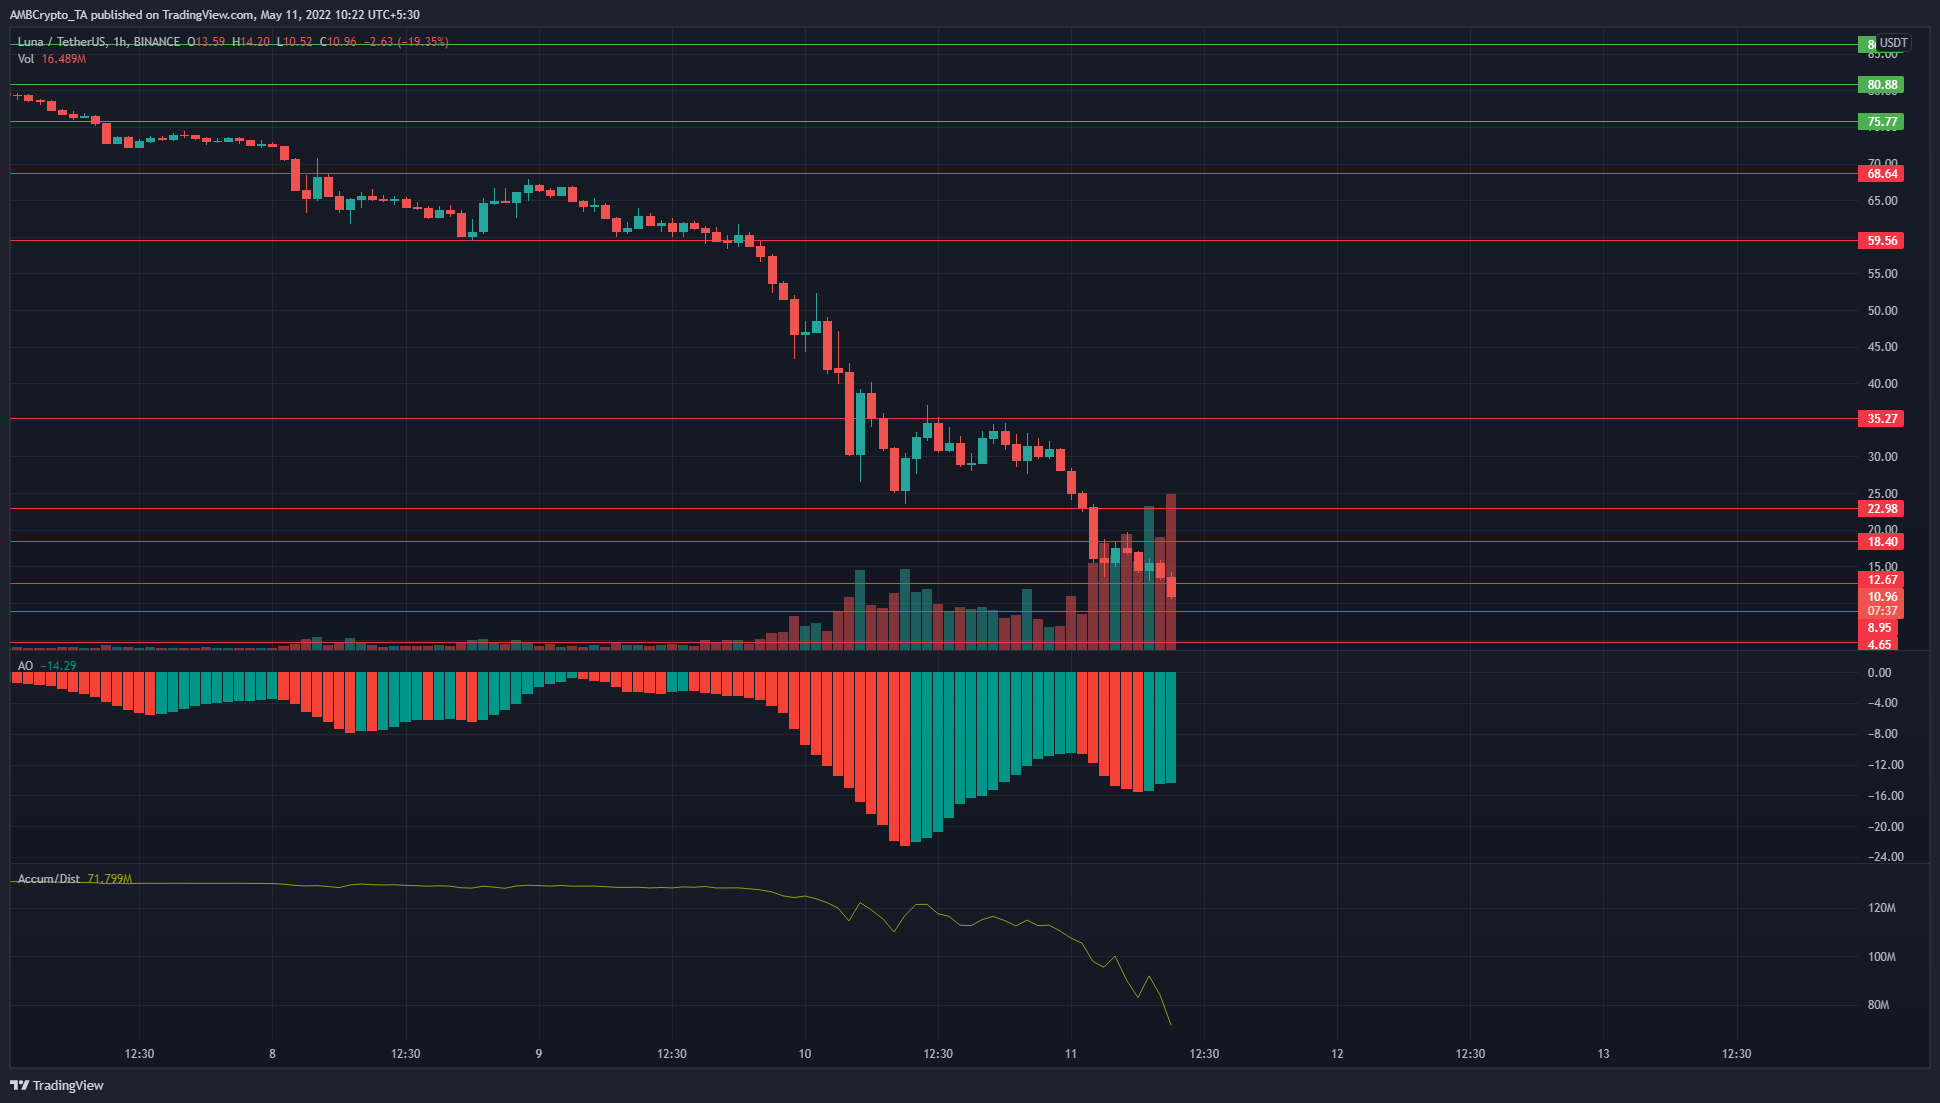
The A/D indicator showed heavy selling volume behind LUNA in the past few days. The Awesome Oscillator showed weakening bearish momentum even as the price made a lower low. Does this bullish divergence warrant a buy LUNA? Absolutely not! Long-term investors can look to buy some LUNA at or even under the $10 mark, as Do Kwon tweeted that a recovery plan for UST was around the corner.
The time to short LUNA was when it first fell below $70. In the short term, a long or short position on LUNA could be extremely risky given the market volatility. Long-term investors could look into dollar-cost averaging into a position on LUNA with faith in a recovery in the weeks to come.
Cardano (ADA)
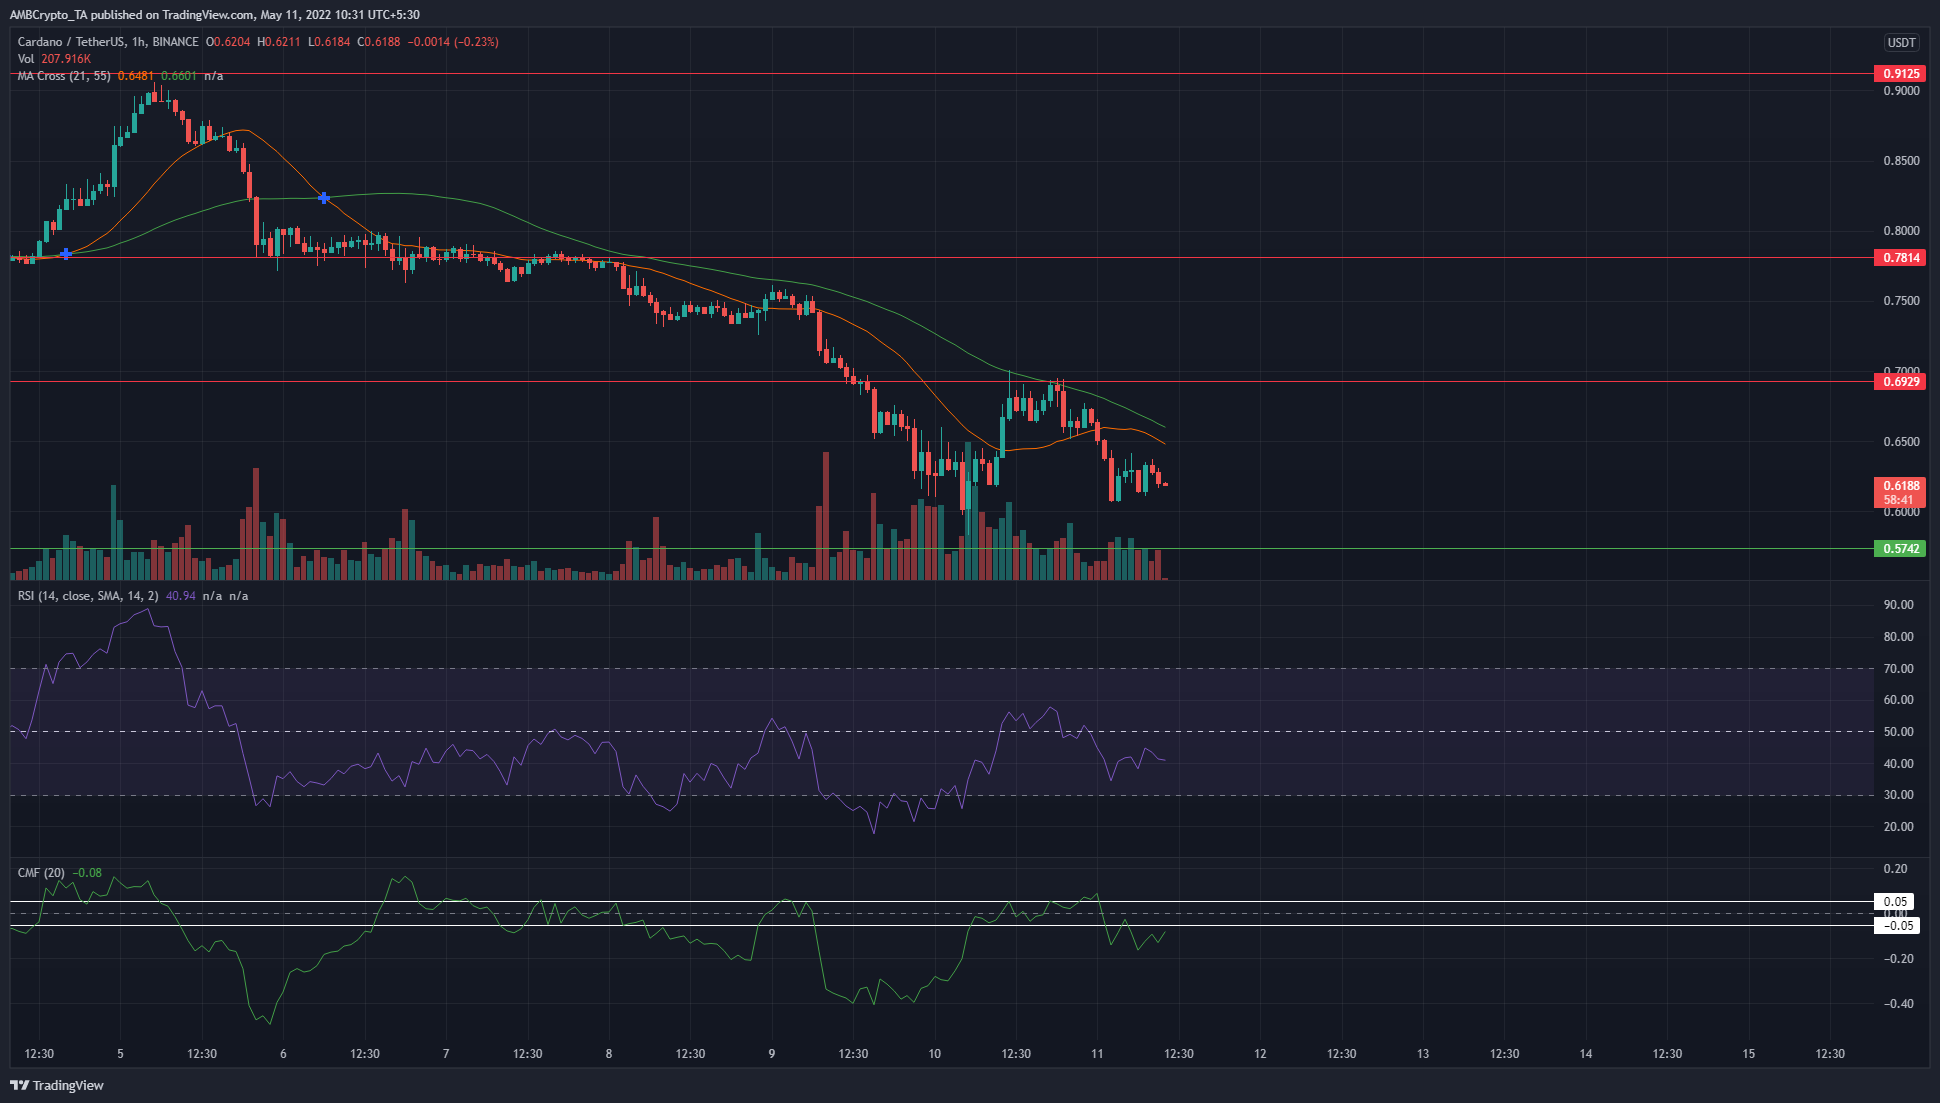
Cardano retested the $0.69 level as resistance the previous day. The RSI attempted to climb past neutral 50 to indicate a shift in momentum toward the bulls but was unable to. The CMF was also beneath the -0.05 mark, which suggested significant capital flow out of the market.
The moving averages also showed bearish momentum as the 21-SMA (orange) was moving beneath the 55-SMA (green), which also acted as resistance in the past few days. The next horizontal support for ADA lies at $0.57.
Avalanche (AVAX)
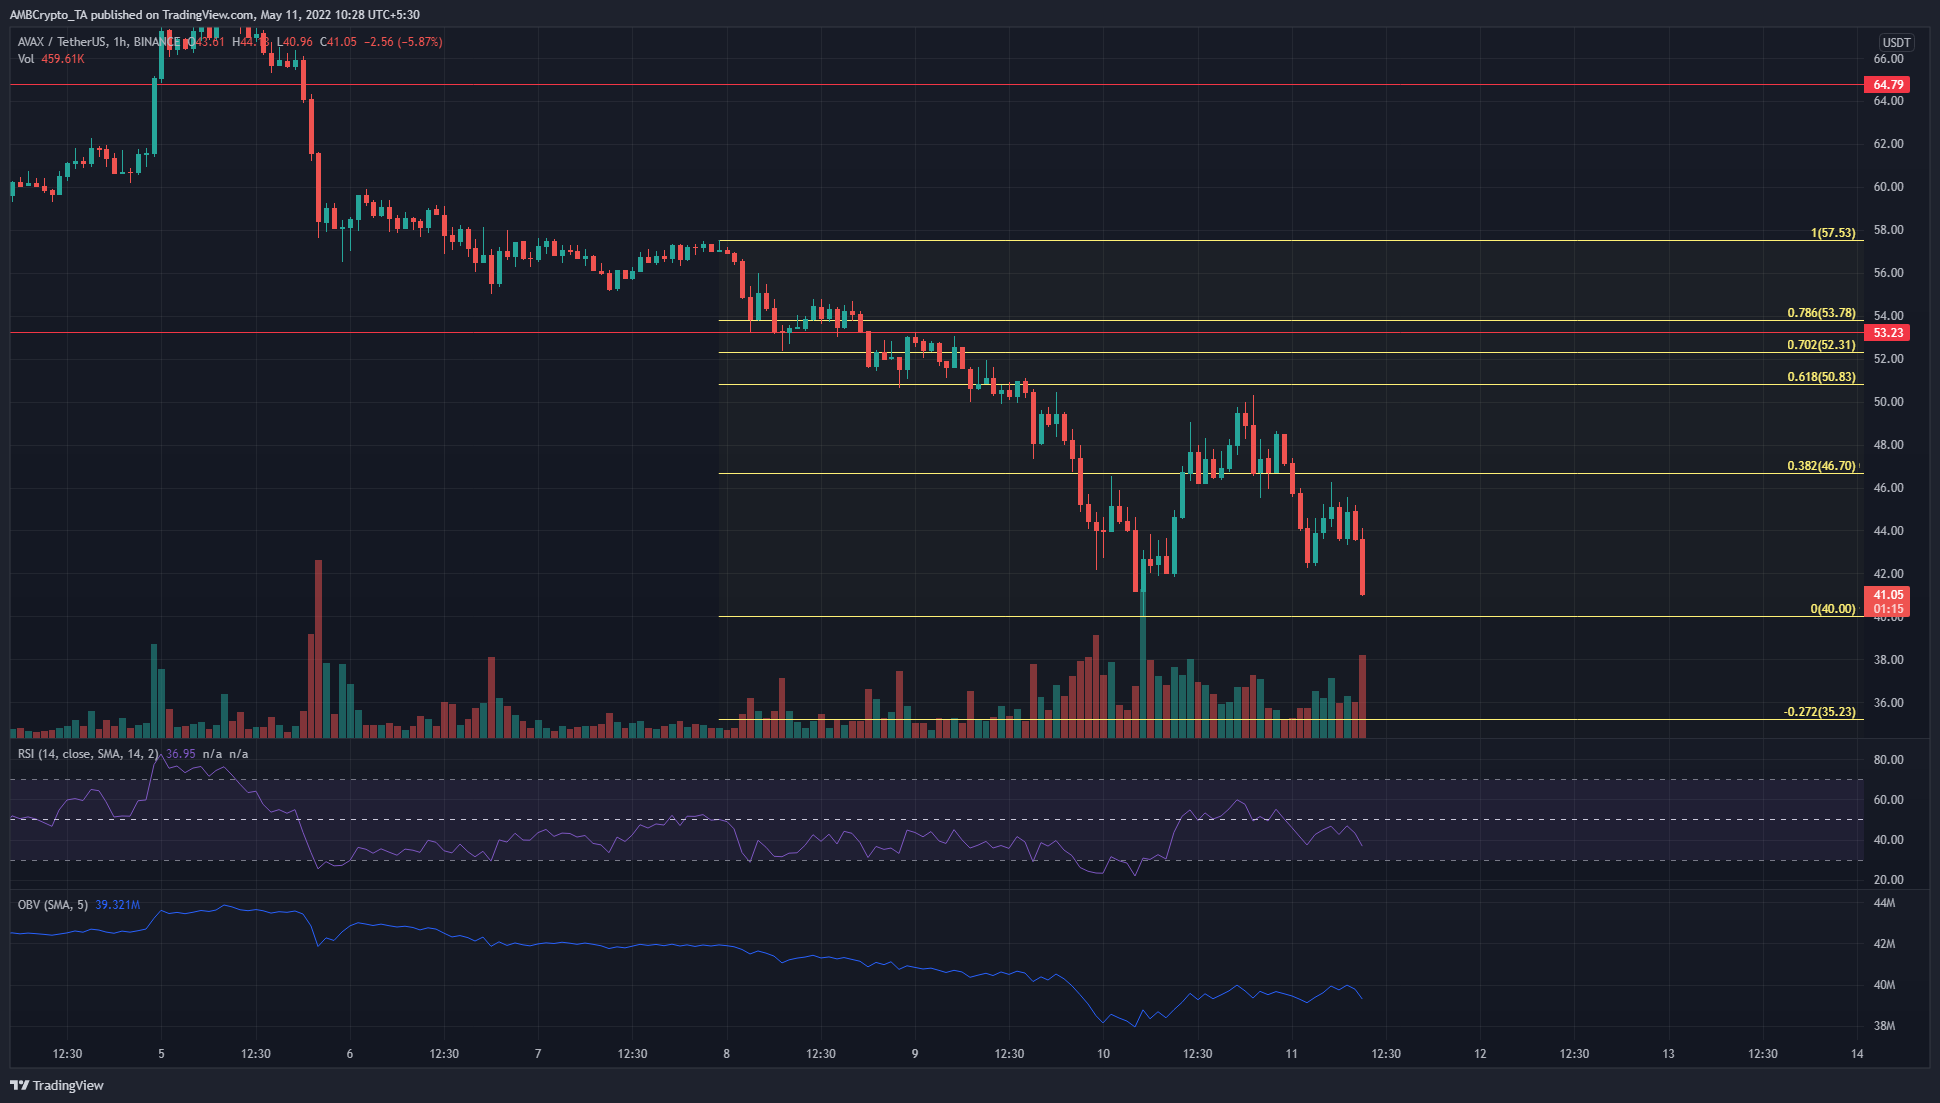
The market structure was decisively bearish as the price set a series of lower highs and lower lows in the past week, barring a breakout above the $64 level that was quickly reversed. The Fibonacci retracement levels (yellow) showed that AVAX bulls made a good effort to drive prices past $46.7, the 38.6% retracement level. However, they were rebuffed after a day of skirmishing.
This meant the $40 and the $35.23 (27.2% extension level) are the next strong levels of support to watch out for. The OBV did bounce in the past few days, but the RSI was back beneath the neutral 50 line to denote strong bearish pressure.


