MANA investors must watch out for this range because…

Disclaimer: The findings of the following analysis are the sole opinions of the writer and should not be considered investment advice
Over the last seven weeks, Decentraland (MANA) has found an oscillation range between $3.3-$2.2. Over the last month, the alt pictured a bearish trendline resistance (white, dashed) whilst the bulls have endeavored to take charge of its near-term trend.
Now, as the buyers build up the pressure, the $2.5-zone stands critical to confirm a strong trend reversal. A fall below its trendline resistance would find testing grounds near the $2.4-mark before it possibly conforms to its bullish tendencies.
At press time, MANA was trading at $2.47, up by 4.64% in the last 24 hours.
MANA 4-hour chart

After nosediving from its ATH, MANA lost over 70% of its value and hit its 11-week low on 22 January. Since then, it has seen promising recovery before reversing from its month-long trendline resistance.
Over the last ten days, MANA grew in a rising wedge (white) on its 4-chart. The price is now approaching a tighter phase after a week-long volatile phase. Thus, the gap between the upper and lower band of the Bollinger Bands (BB) seemed to decrease. Also, the recent bullish engulfing candlestick created a near-term demand zone for the alt in the $2.4-$2.5 range.
From here on, MANA could see growth until the $2.5-mark before the bears attempt a pullback from the upper band of the BB. Furthermore, if the bears keep the trendline resistance intact, the alt will eye hovering in its demand zone while breaking down from its reversal pattern. Any close above $2.5 would confirm a long-term trend reversal on MANA’s 4-hour chart.
Rationale
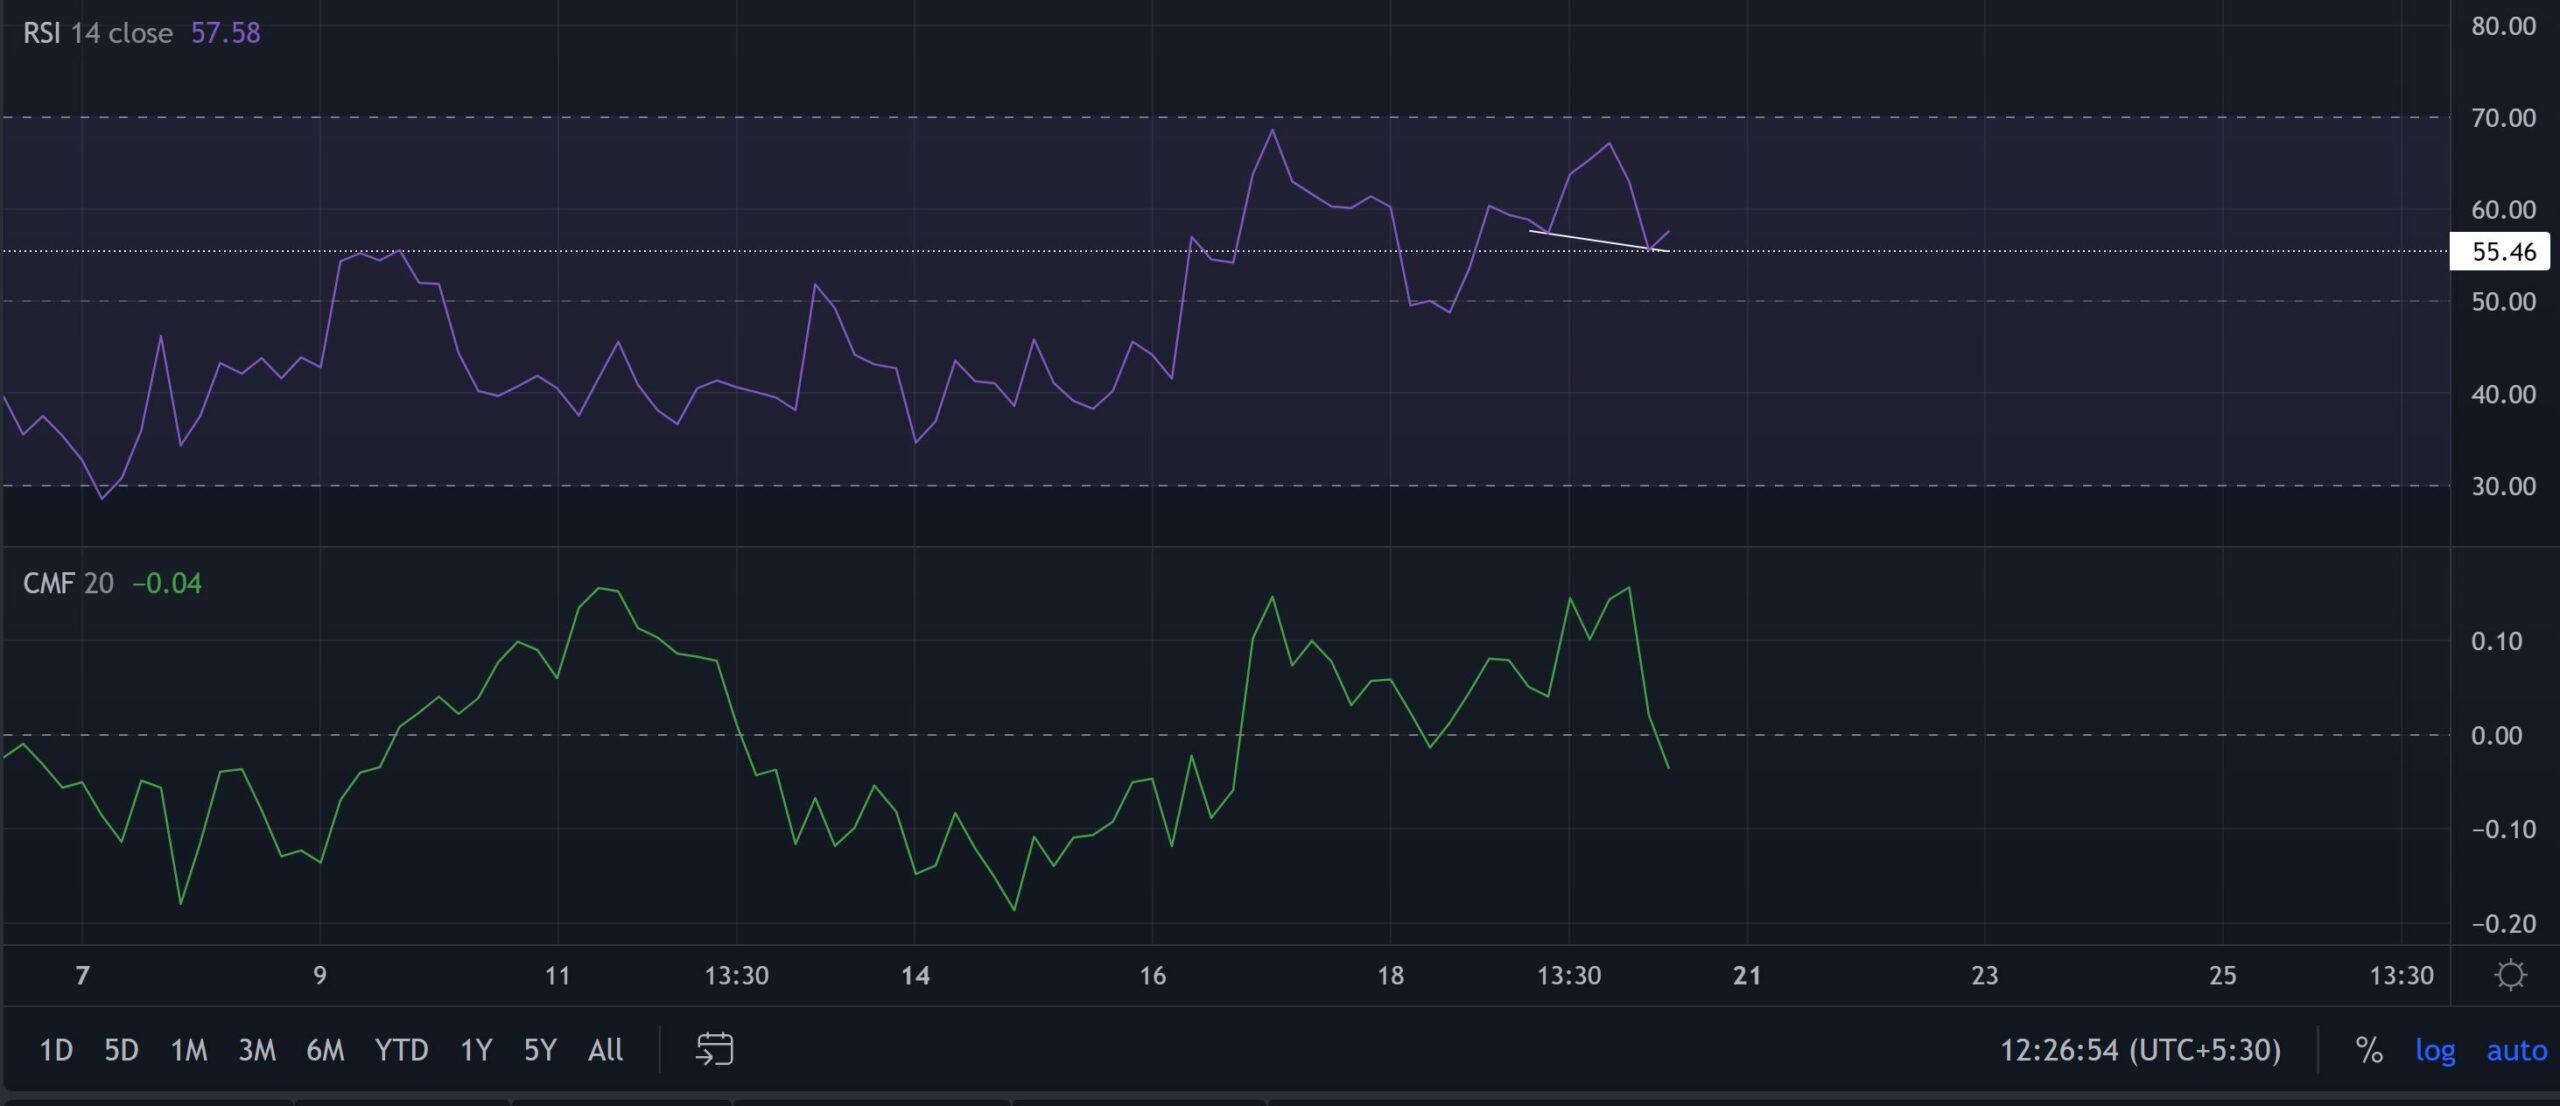
While the 55-mark stood firm, the RSI marked lower troughs on the last day before picking itself up from this level. Hence, revealing a hidden bullish divergence with its price. This reading opened up gates to test the upper band of the BB before a near-term pullback.
Nevertheless, the CMF plunged below the zero-line over the last few hours. This reading hinted at money outflows from the crypto while the fear sentiment prevailed.
Conclusion
As MANA enters a tighter phase, it aims to test the $2.5-zone before facing a possible pullback. Any break below the pattern could lead to a test of the $2.4-support. Moreover, the alt shares a 31% 30-day correlation with Bitcoin. So, keeping a watch on the king coin’s movement would be useful in complementing the above analysis.