MANA stuck in a pronounced downtrend but can buyers show strength to recover

Decentraland has trended downward on the daily chart since its surge to $5.2 in late November, a time period of six weeks. Compared to the amount of time some once-prominent coins have spent in a downtrend, six weeks is a mayfly’s blink. The long-term outlook for Bitcoin and the crypto market has not decisively shifted to a bearish one. Hence, although Decentraland was expected to continue its downtrend, some respite can be expected at the next area of demand.
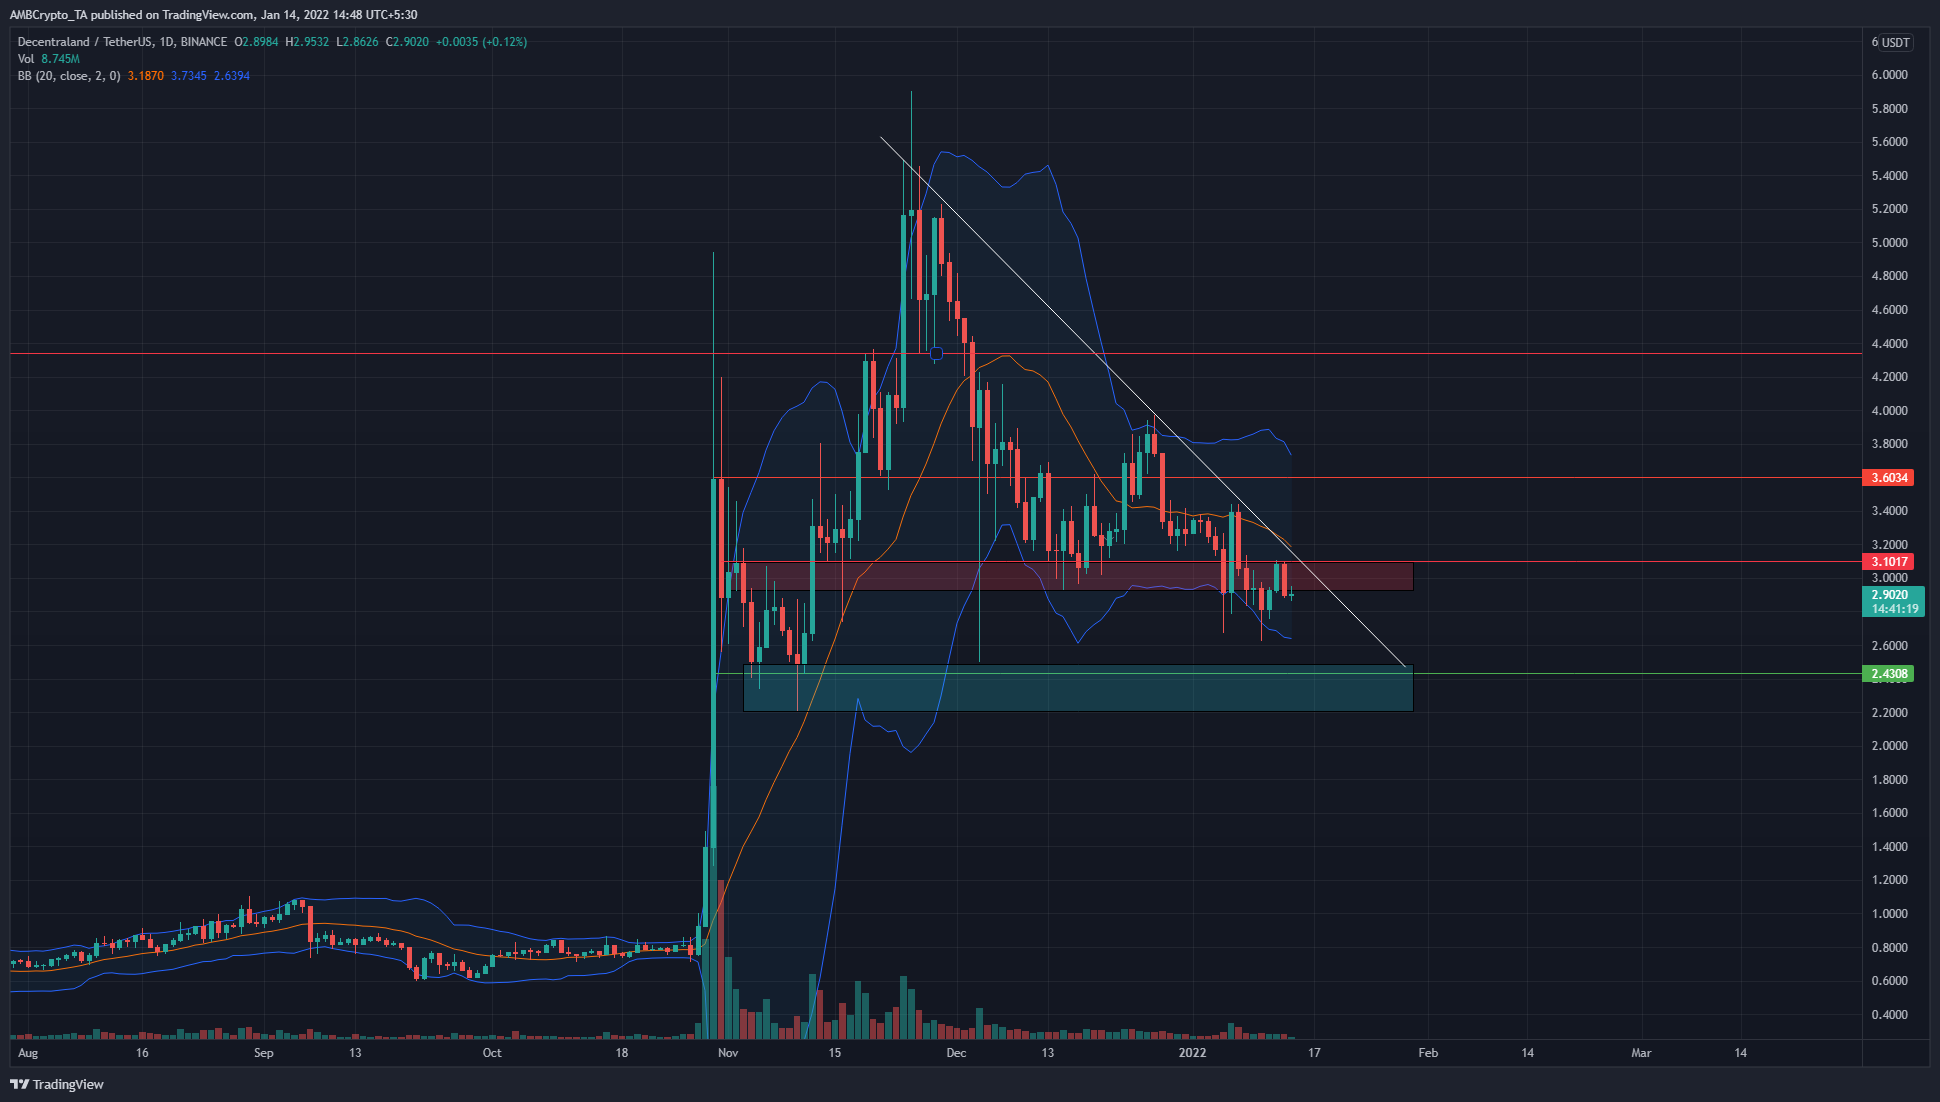
The $3.1-$2.9 area (red box) has been tested to find demand in the past couple of months. However, in the month of January, the price has closed beneath the $3.1 level multiple times and tested it as a level of resistance a couple of days prior to press time. Moreover, the previous day’s candle was a bearish engulfing pattern.
Combined with the confluence of an S/R flip, this signaled that MANA could drop in the days to come. The $2.43 level was the next significant support level, with the $2.2 area (cyan) being an area where demand could step in.
The 20-period SMA in the Bollinger bands acted as resistance, while the bands themselves widened recently. This showed that MANA was trending downward. A test of the lower band can see the price bounce and could offer intraday scalping opportunities.
Rationale
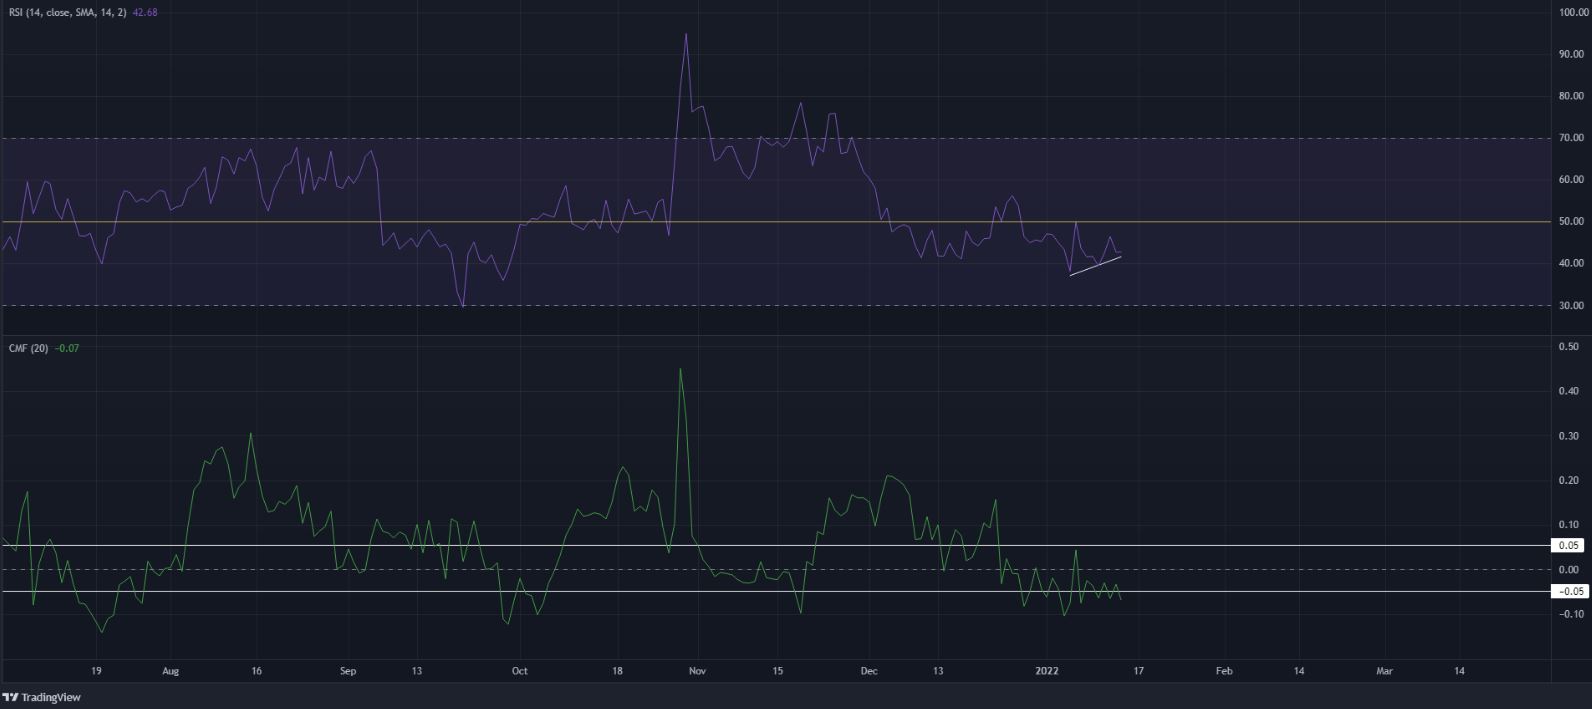
The RSI has been moving beneath the neutral 50-line to show that momentum has been on the side of the sellers in recent weeks. However, the RSI formed higher lows even as the price formed lower lows. This bullish divergence saw the price bounce and retest the former support level as resistance.
The CMF was at the -0.05 mark and has oscillated about this level over the past few days. This showed that capital flow was directed outward from the market, another sign of seller strength.
Conclusion
The trendline resistance was unbroken and sellers were driving the prices lower in search of significant liquidity. The $2.4 area could be a place where this demand can appear. The rejection at the $3.1 level, followed by a strongly bearish daily candle, indicated a bearish order block. This meant that Decentraland was likely to see a quick move to the next significant level of support.


