MANTA’s predictions amid price volatility suggest this…

- MANTA’s market structure shifted bearish on the lower timeframes.
- The momentum and volume indicators continued to support a bullish bias.
Manta Network [MANTA] saw its short-term market structure shift bearishly after a 7% drop on the 28th of January. Since then, the price has bounced and recovered most of those losses.
The listing of MANTA on major exchanges last week was followed by a massive jump in the Total Value Locked [TVL]. The official airdrop was on 18th January, but the bullish sentiment has begun to slow down.
The implication of the bearish chart pattern
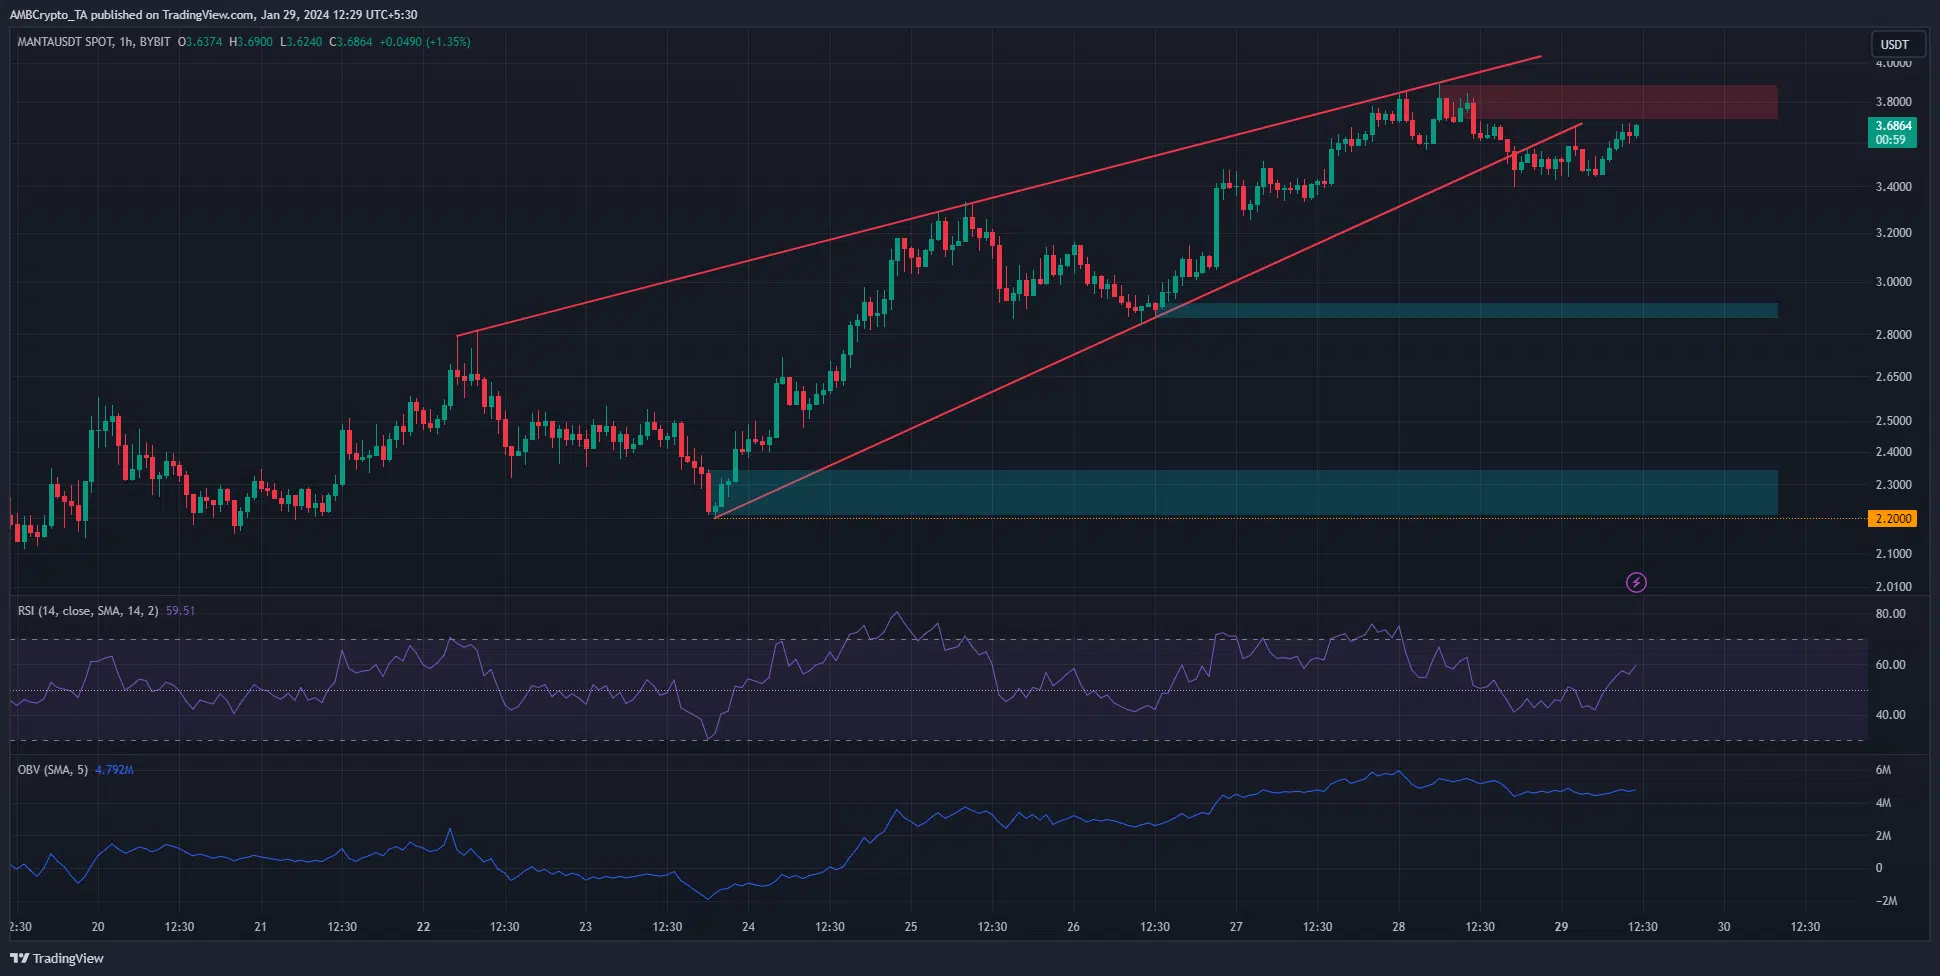
The one-hour price chart of MANTA showed that the recent lower high at $3.565 was breached at press time. This meant that the short-term market structure was bearish.
However, the $3.33-$3.45 was a demand zone where prices had consolidated on the 26th of January before rallying higher.
The $3.8 zone was highlighted by the red box to demarcate a bearish order block. This is a supply zone that MANTA was likely to retest before a move downward.
The rising wedge pattern (red) saw a breakout downward as well.
Combined with the market structure shift, a move to the $2.9 support zone appeared possible. Yet, the RSI was not below neutral 50 to indicate bearish momentum.
Neither was the OBV in a pronounced downtrend to signal firm selling pressure.
The structure shift saw speculator sentiment sway

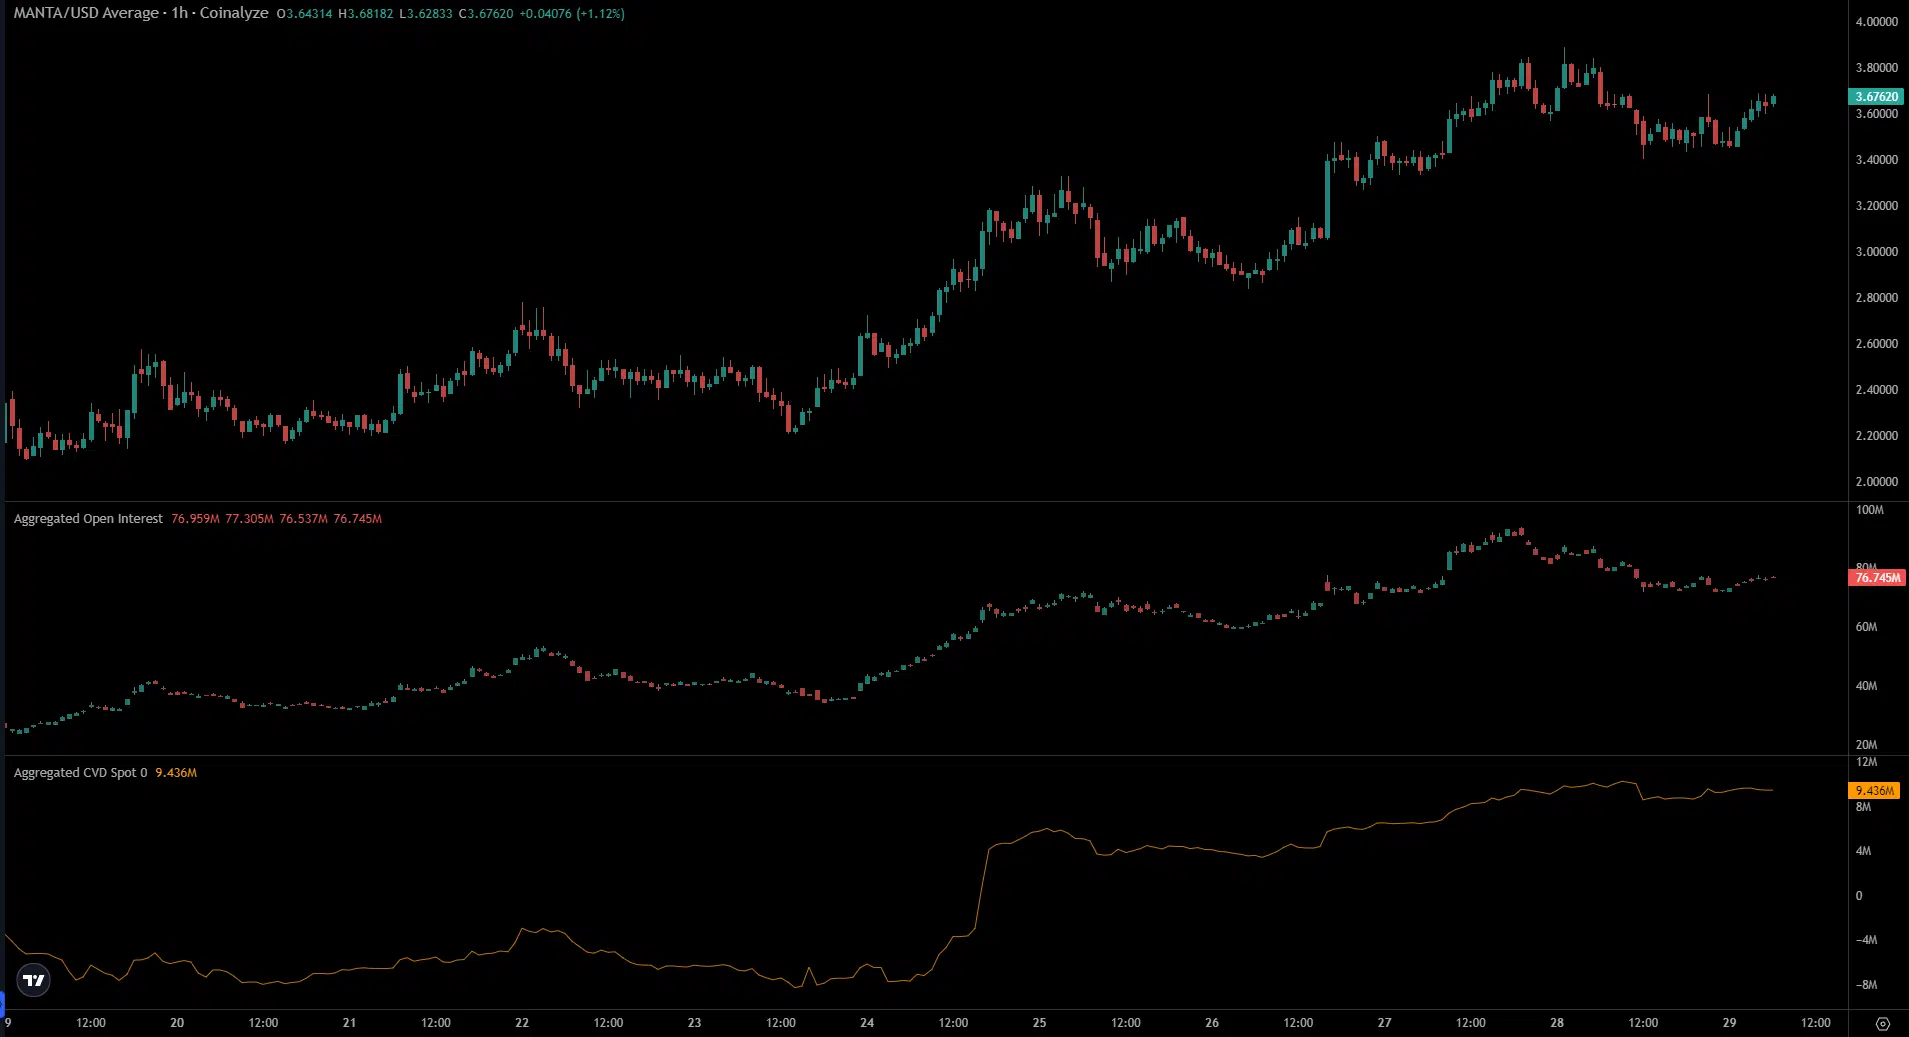
Source: Coinalyze
The past 24 hours of trading saw MANTA fall, then climb higher once more. Yet, the Open Interest chart has trended downward since the 27th of January.
The inference was that the market sentiment was bearish in the short term.
How much are 1, 10, or 100 MANTA worth today?
On the other hand, the spot CVD continued to trend upward despite a brief dip on the 28th of January.
Buying activity in the spot markets remained strong, undermining the idea of a short-term bearish trend for MANTA. Buyers could wait for a move past $3.89 and a retest of the same to go long.
Disclaimer: The information presented does not constitute financial, investment, trading, or other types of advice and is solely the writer’s opinion.


