Analyzing MANTA’s 6% price crash – Reasons why predictions are bearish

- Bearish sentiment around the MANTA token increased over the last few days
- However, a few market indicators remained bullish
Manta Network [MANTA] boasted of a comfortable rally of late, allowing it to gain 33% in the last seven days. This price rise helped the token rise to the top spot on CoinMarketCap’s list of trending coins.
However, the rally may not continue for long, as MANTA’s chart had turned red at press time.
Are MANTA’s bears here?
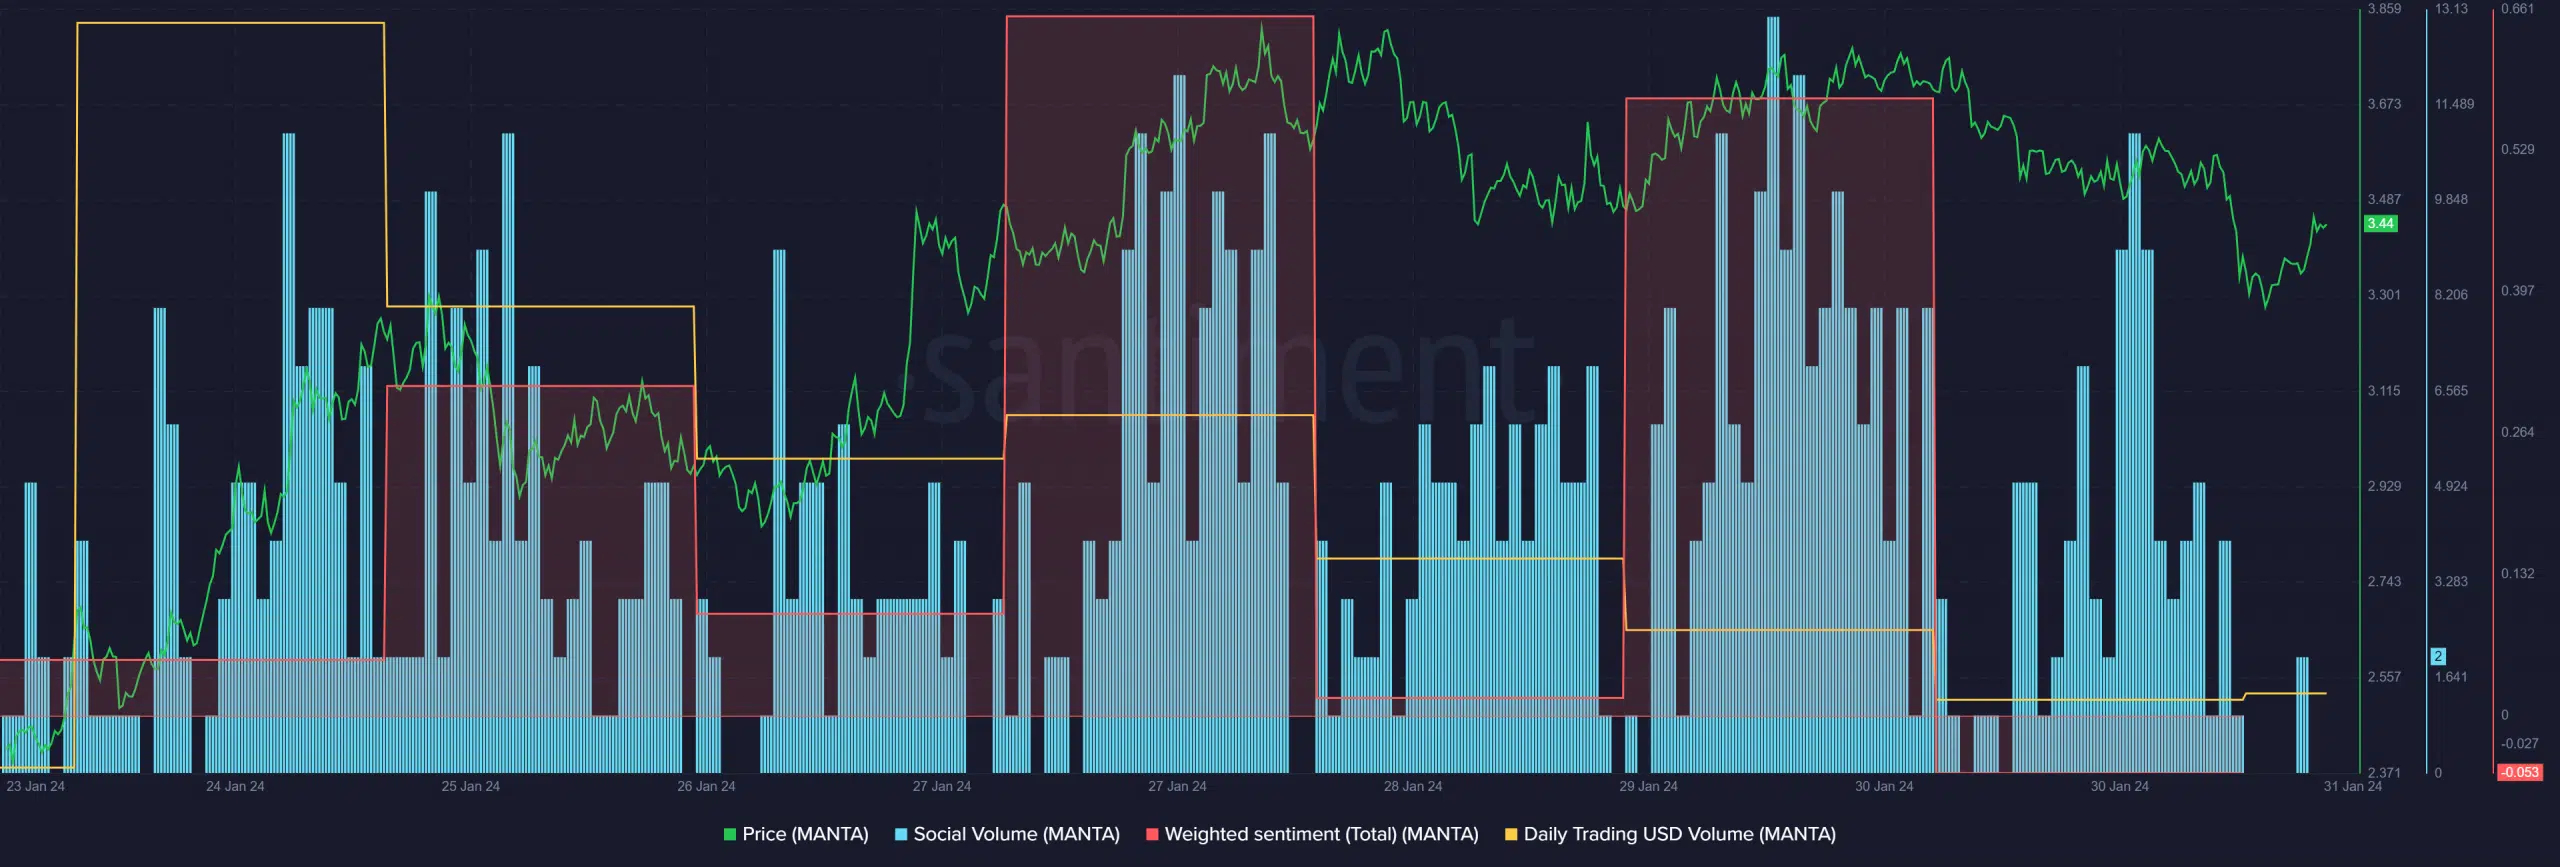
MANTA’s price dropped by more than 6% in the last 24 hours. At the time of writing, it was trading at $3.43 with a market capitalization of over $860 million. AMBCrypto’s look at Santiment’s data pointed out quite a few bearish metrics. For example, Manta Network’s Social Value spiked while its Daily Trading USD Volume plummeted sharply.
The recent price downtrend also caused a massive drop in its Weighted Sentiment, meaning that bearish sentiment had started to increase at press time.
Nonetheless, its Social Volume remained high, which can be attributed to MANTA’s highly volatile price action.
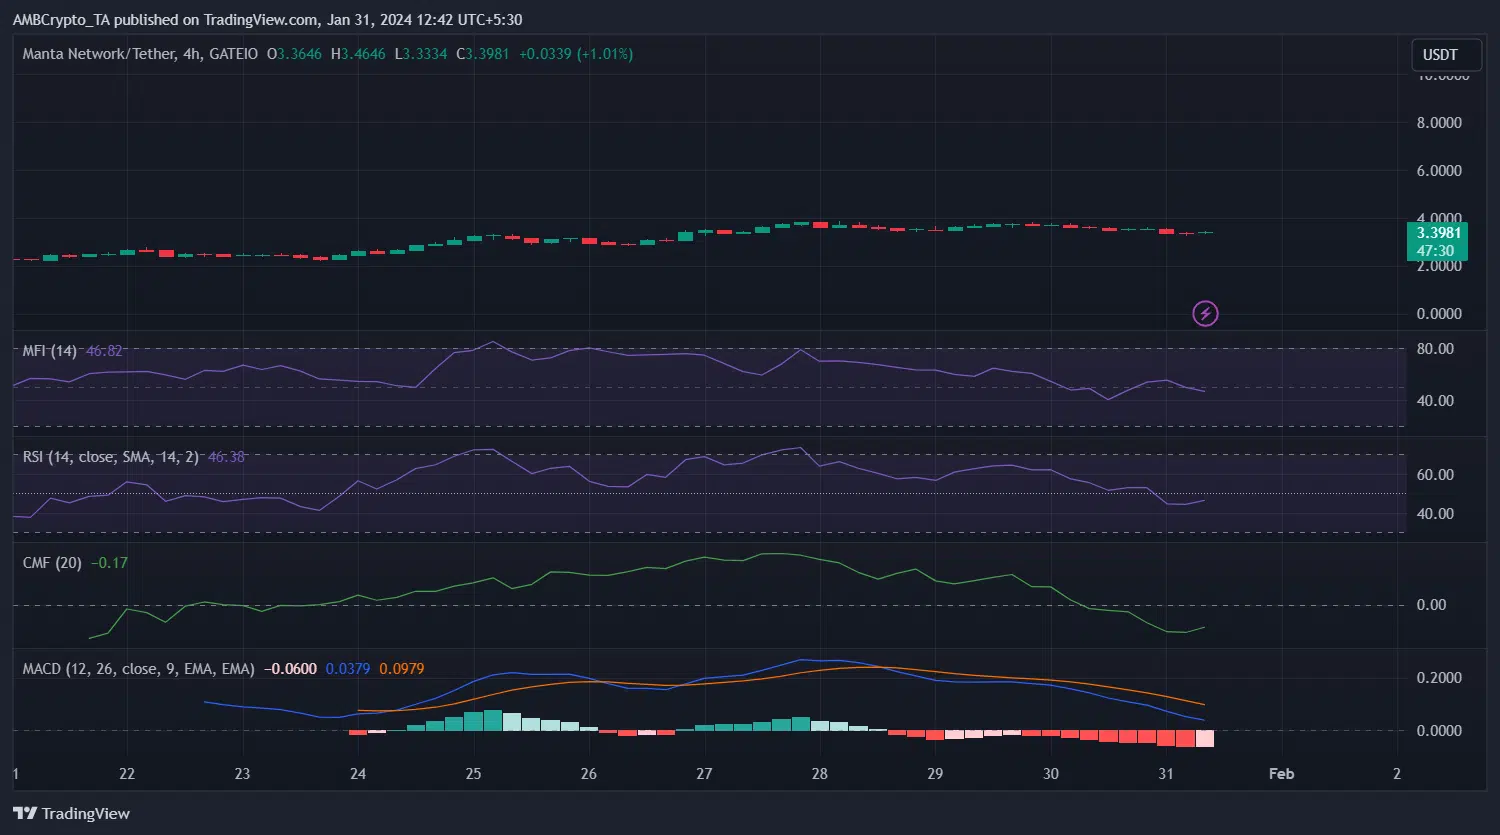
To understand whether the price decline would continue, AMBCrypto took a look at the token’s 4-hour chart. Our analysis revealed that the MACD displayed a clear bearish advantage in the market. Its Money Flow Index (MFI) also registered a downtick and was headed below the neutral zone at press time.
Nonetheless, a few other metrics suggest otherwise. Manta Network’s Relative Strength Index and Chaikin Money Flow registered increases, indicating a high likelihood of a price increase soon.
Here’s the good part
Apart from the RSI and CMF, a few other metrics looked bullish as well. Notably, Coinglass’ charts revealed that despite the latest price drop, MANTA’s Open Interest remained stable.
A similar trend was also noted in terms of its Funding Rate, suggesting that Futures investors were actively buying MANTA at press time.
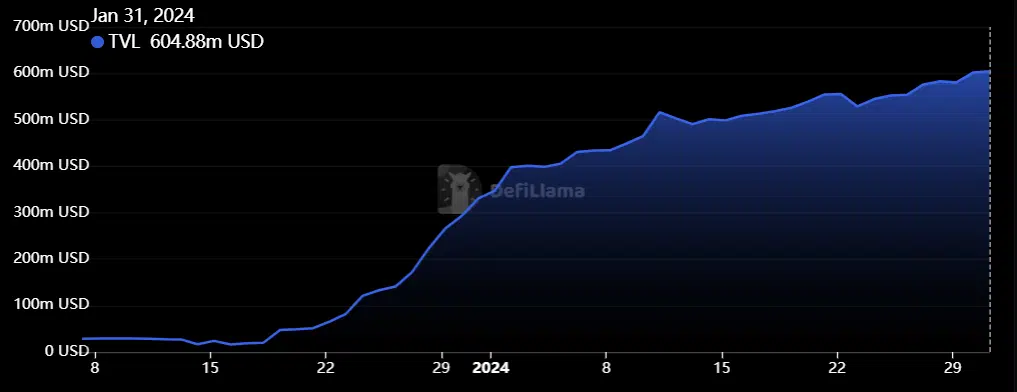
AMBCrypto had earlier reported how the blockchain’s TVL was on the rise, which occupied 7% of the market share at press time, making it the third-largest L2. The latest data also revealed an upward-moving graph.
Our look at DeFiLlama’s data revealed that, at the time of writing, Manta Network’s TVL stood at $604.88 million. These metrics are indicative of the fact that bears may not get a firm hold of MANTA just yet.
Is there cause for concern?
Despite MANTA’s price going down in the last 24 hours, it would be too soon to draw the curtains on its bull run. Considering that MANTA surged by 33% last week, one could argue that a drop of 6% in 24 hours is “normal.”
How much are 1,10,100 MANTAs worth today?
Such occurrences are widespread in the crypto market, taking into account its highly volatile and unpredictable nature. So, only time will tell whether there’s more to MANTA’s recent price movements than what meets the eye.


