Mapping odds of DOGE whales sustaining rally beyond $0.14

Disclaimer: The findings of the following analysis are the sole opinions of the writer and should not be considered investment advice
The 61.8% Fibonacci resistance played out expectedly for Dogecoin (DOGE) after its price suffered a nearly 19.4% decline over 12 days. Sellers were quick to pull back the price point below $0.148.
As the buyers start building up pressure at the 38.2% Fibonacci resistance, the price action could see an extended tight phase before a bull run. At press time, DOGE was trading at $0.1444.
DOGE Daily Chart
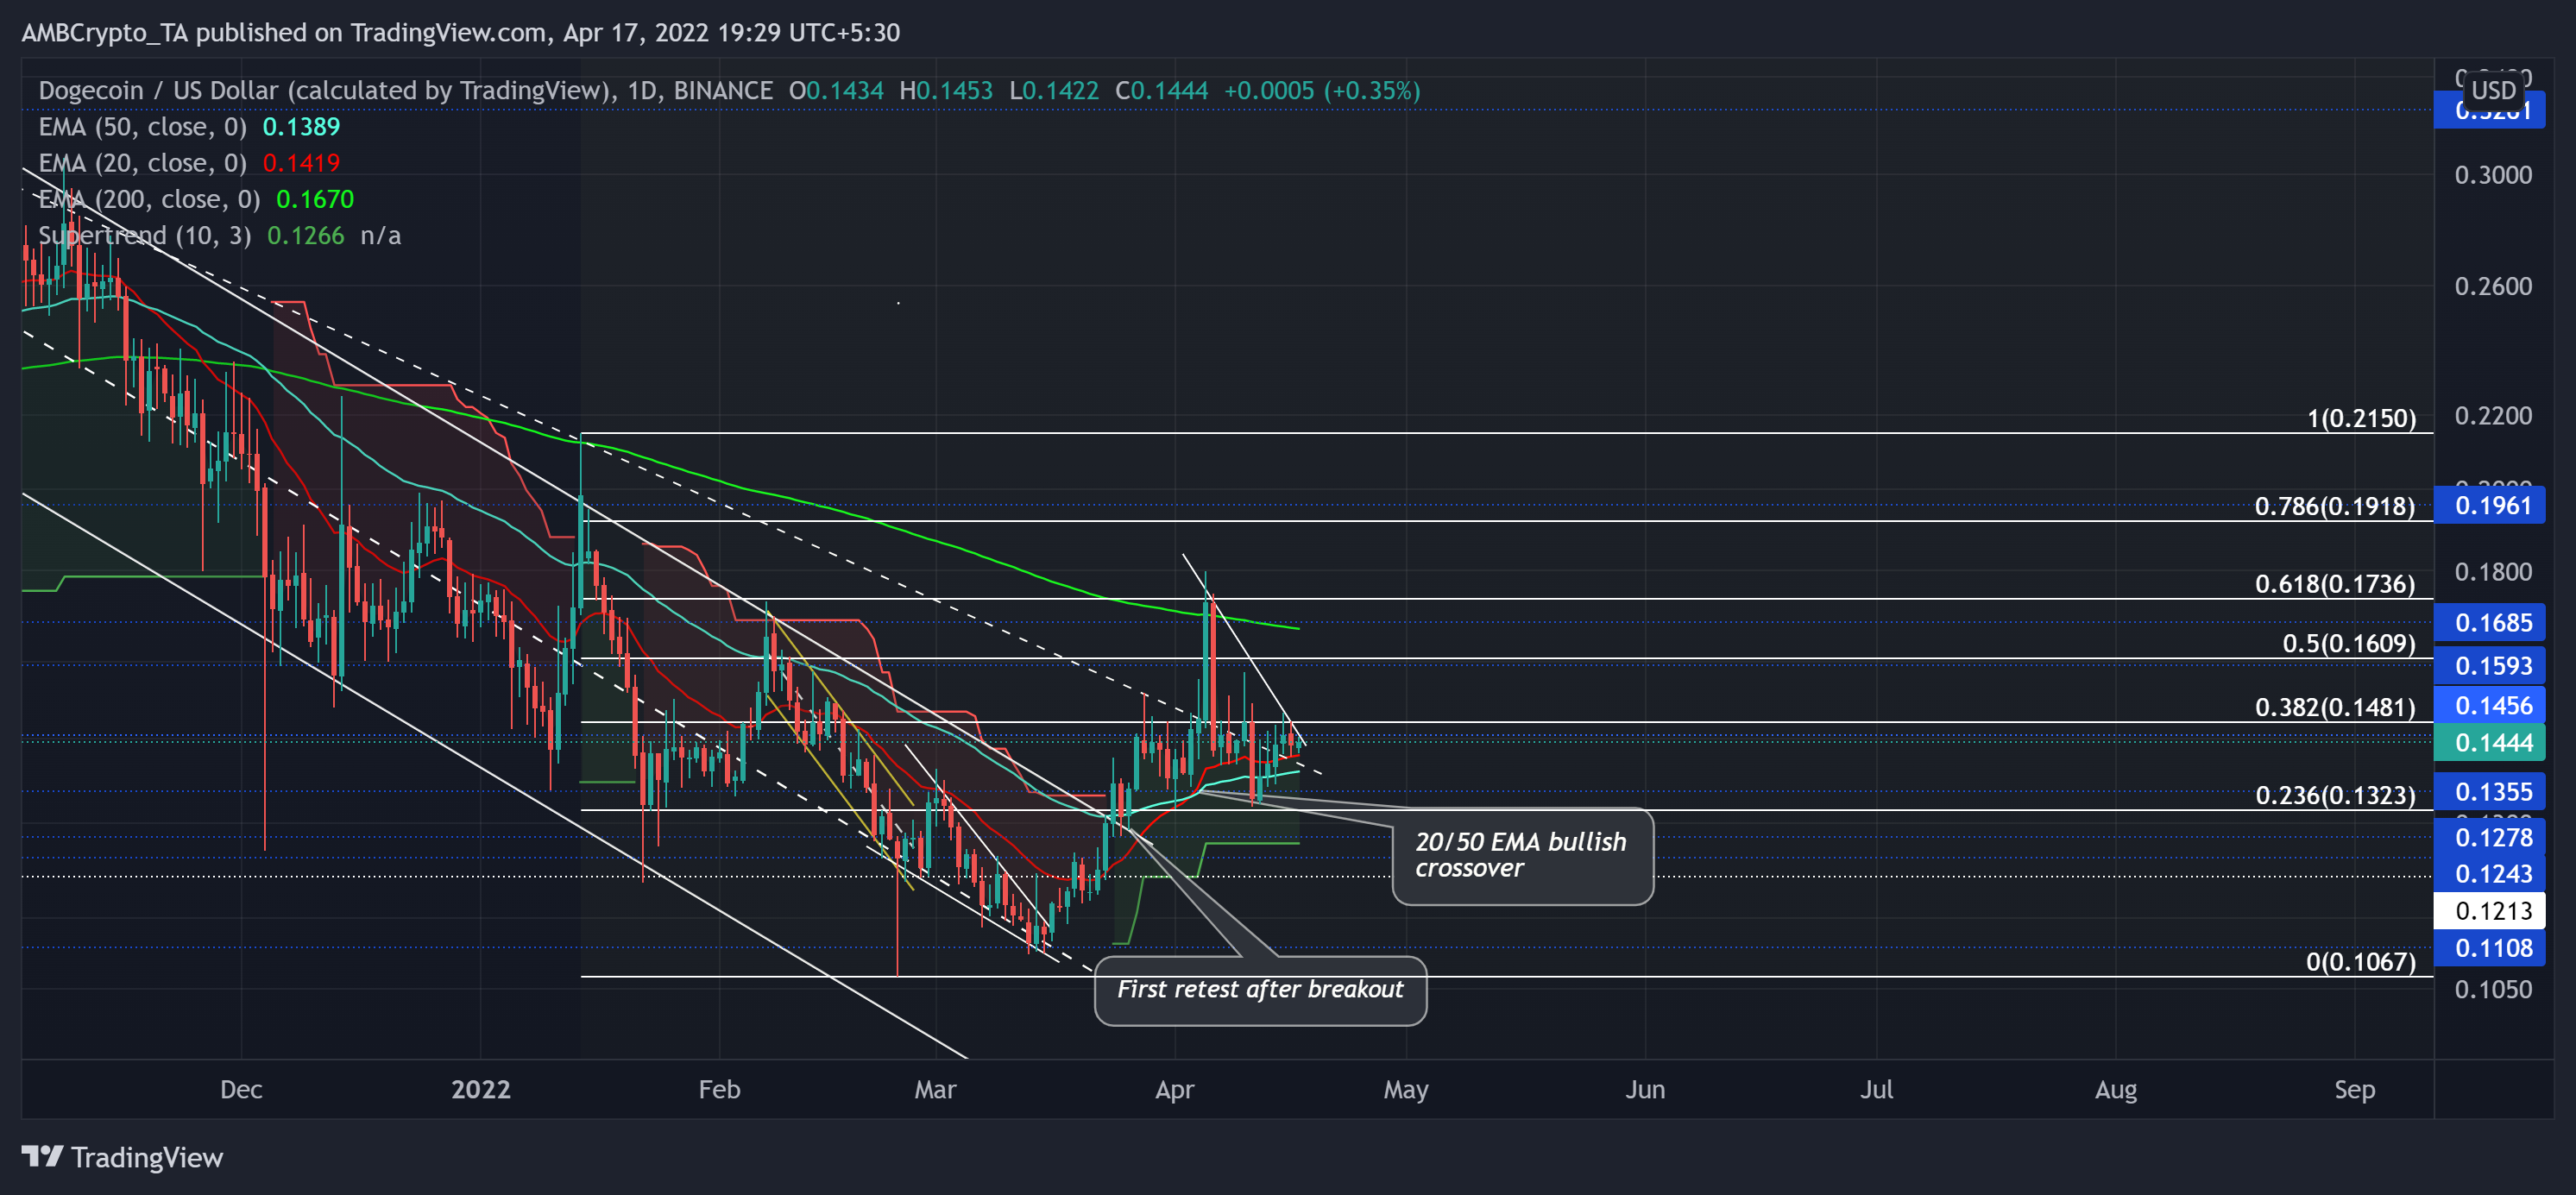
The alt’s latest breakdown from its 200 EMA (green) pushed the price back towards the critical price level of $0.13. This fall was preceded by a revival from its four-month down-channel (white) breakout rally. The corresponding growth entailed a bullish crossover of the 20 EMA (red) with the 50 EMA (cyan). Thus, revealing a gradual increase in buying force over the past month.
As the price traded around its near-term moving averages, the price would likely break into high volatility in the coming days. In the best-case outcome, a comeback above $0.14 would lay the foundation for a rally towards the $0.16 and $0.17-range. To top it up, the Supertrend kept its bullish position intact whilst the moving averages tilted north.
Conversely, the inability to find a close above the 38.2%-level after multiple retests could cripple recovery hopes. Especially towards the long-term bullish target of $0.17.
Rationale
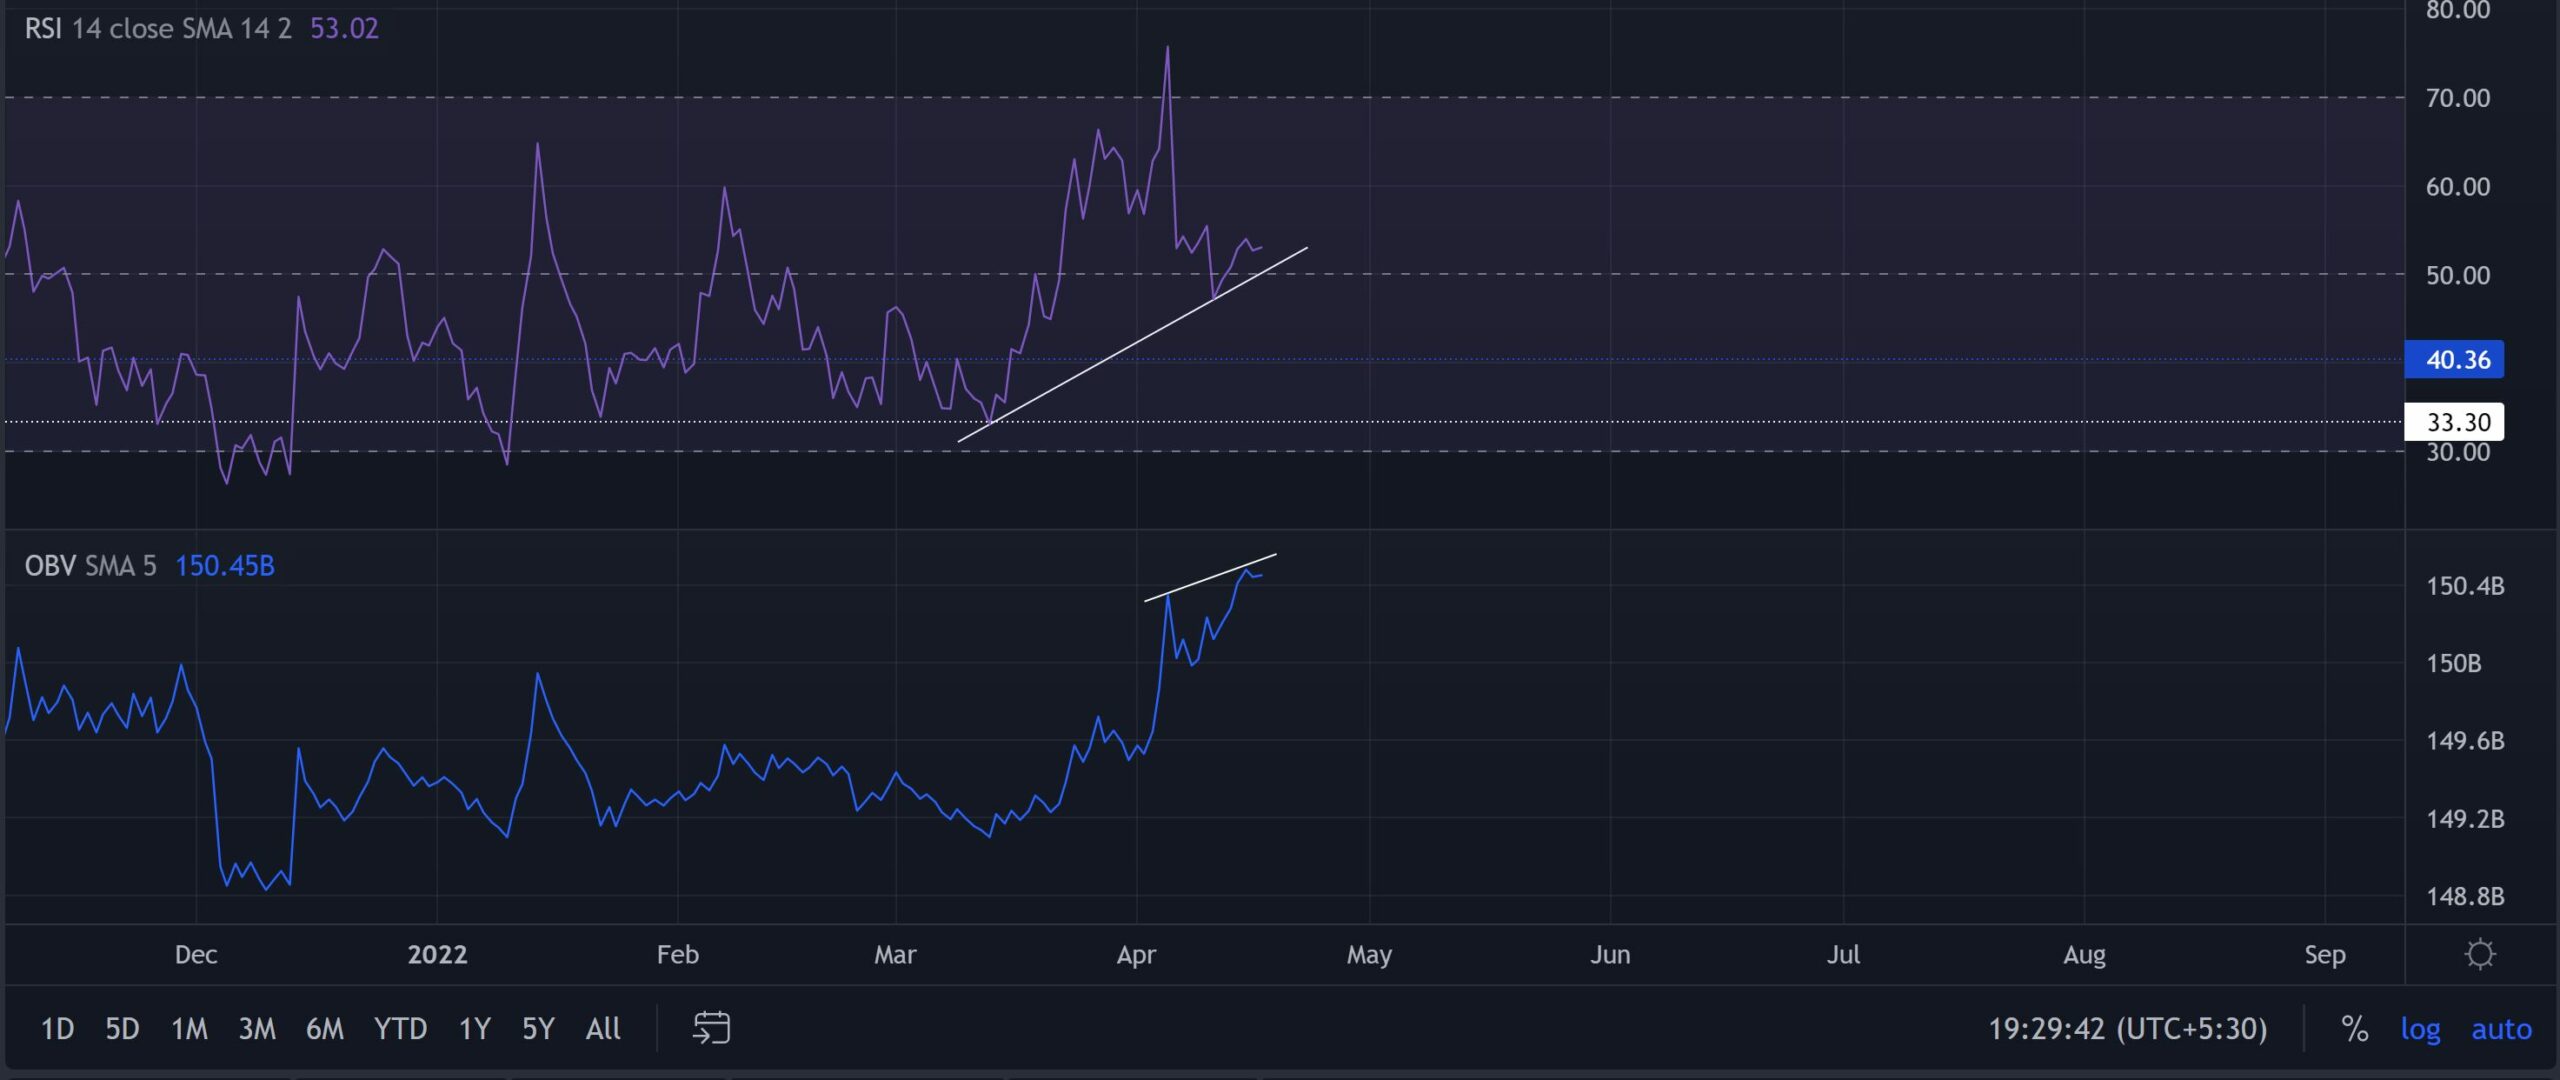
Despite the recent pullback, the Relative Strength Index swayed above its equilibrium. Any retracements could find support near its trendline support. In such a case, the alt could see a near-term lapse before a gradual recovery on its charts.
The OBV accommodated higher peaks whereas the price action took a plunge on its peaks in the last 11 days. This trajectory revealed a hidden bearish divergence. Thus, the buyers could find it difficult to propel an unrestrained rally in the coming days.
Conclusion
Giving due importance to the bearish divergence on the OBV and the 38.2% Fibonacci resistance, DOGE could see a setback in the short term. However, the movements of its near-term moving averages keep up the long-term recovery hopes alive.
Even so, the dog-themed coin shares a 33% 30-day correlation with the king coin. Thus, keeping an eye on Bitcoin’s movement would complement these technical factors.