Mapping out the odds of Uniswap attempting a reversal

Since falling from its ATH last year, Uniswap (UNI) bulls showed resistance at the $23.6-mark but failed to counter the increasing selling pressure over the past few months.
Going ahead, a likely close above the 20 EMA (red) would open up chances for a test of the $9-$10 range. Following this, UNI would aim to retest its long-term trendline support (white, dashed). At press time, UNI traded at $8.78, up by 6.3% in the last 24 hours.
UNI Daily Chart
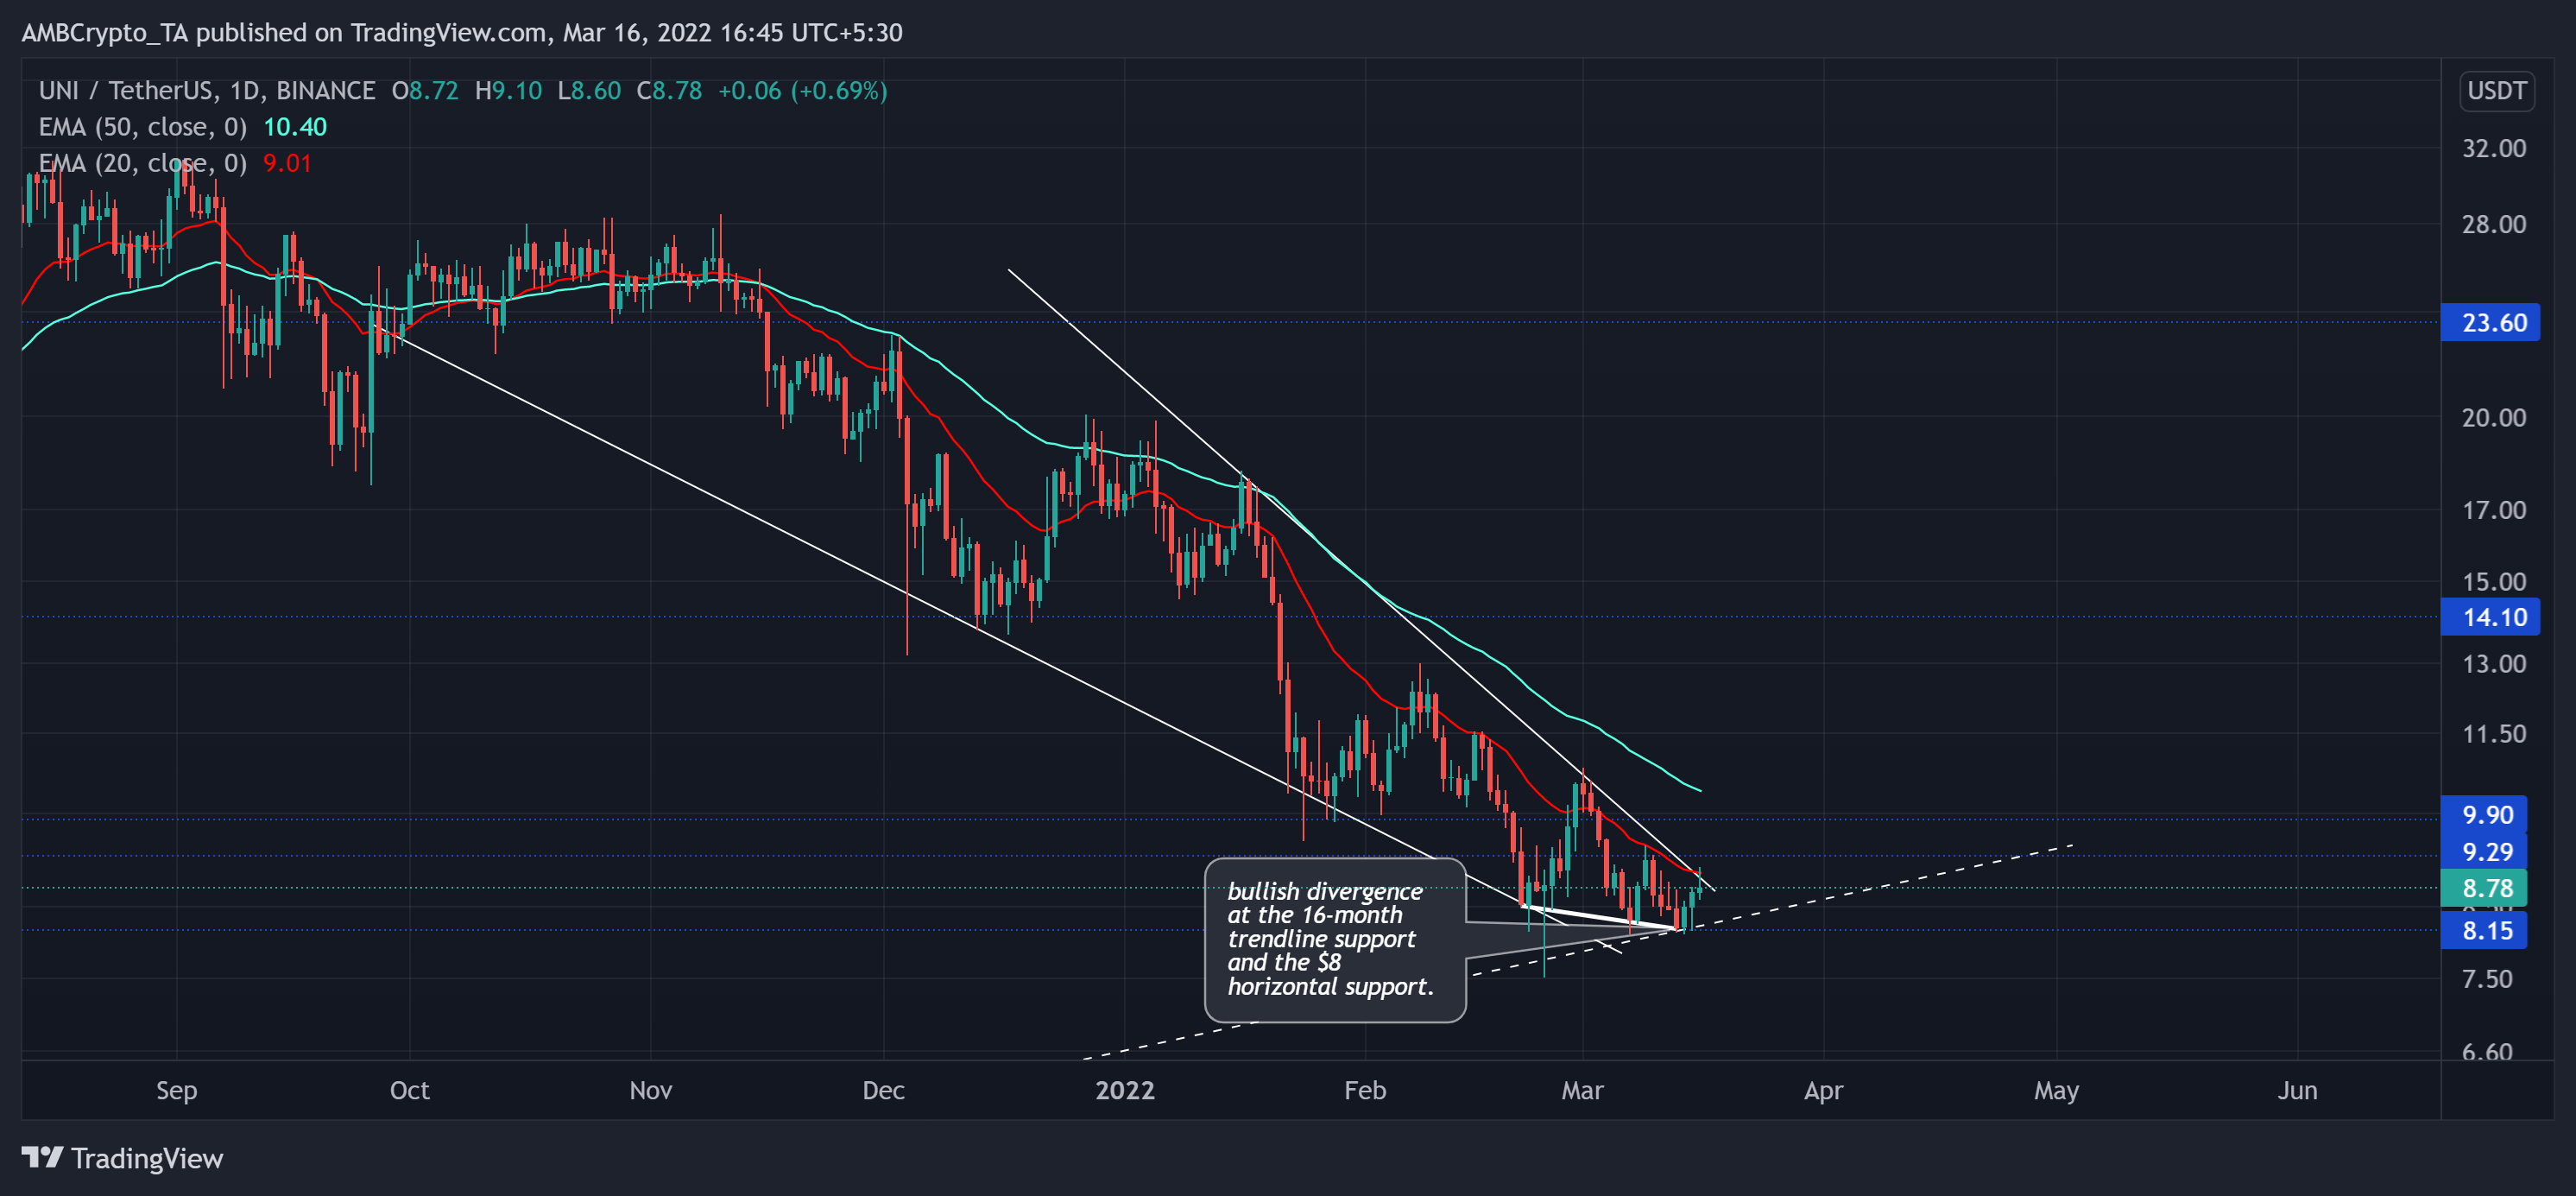
Ever since losing the $23.6-mark, UNI bulls have not been able to propel a trend-altering rally. The alt noted a 68.6% fall (from 16 November) and touched its one-year low on 24 February.
Since then, all recovery attempts by the alt were shunned by the 20 EMA and the upper trendline of the long-term falling wedge. Over the last few days, the buyers have been building up some pressure around the tip of the falling wedge. While the price saw a bullish divergence with the RSI, the recent candlesticks tested the $9-mark.
The $8 base is a confluence of the 16-month-long trendline support and the horizontal support. Thus, the buyers could be keen to step in and defend this mark while initiating a near-term recovery. Any close above the $9-mark would trigger a test near the 50 EMA (cyan). Whereas a reversal inside the current pattern could retest the trendline support before a recovery towards the above level.
Rationale
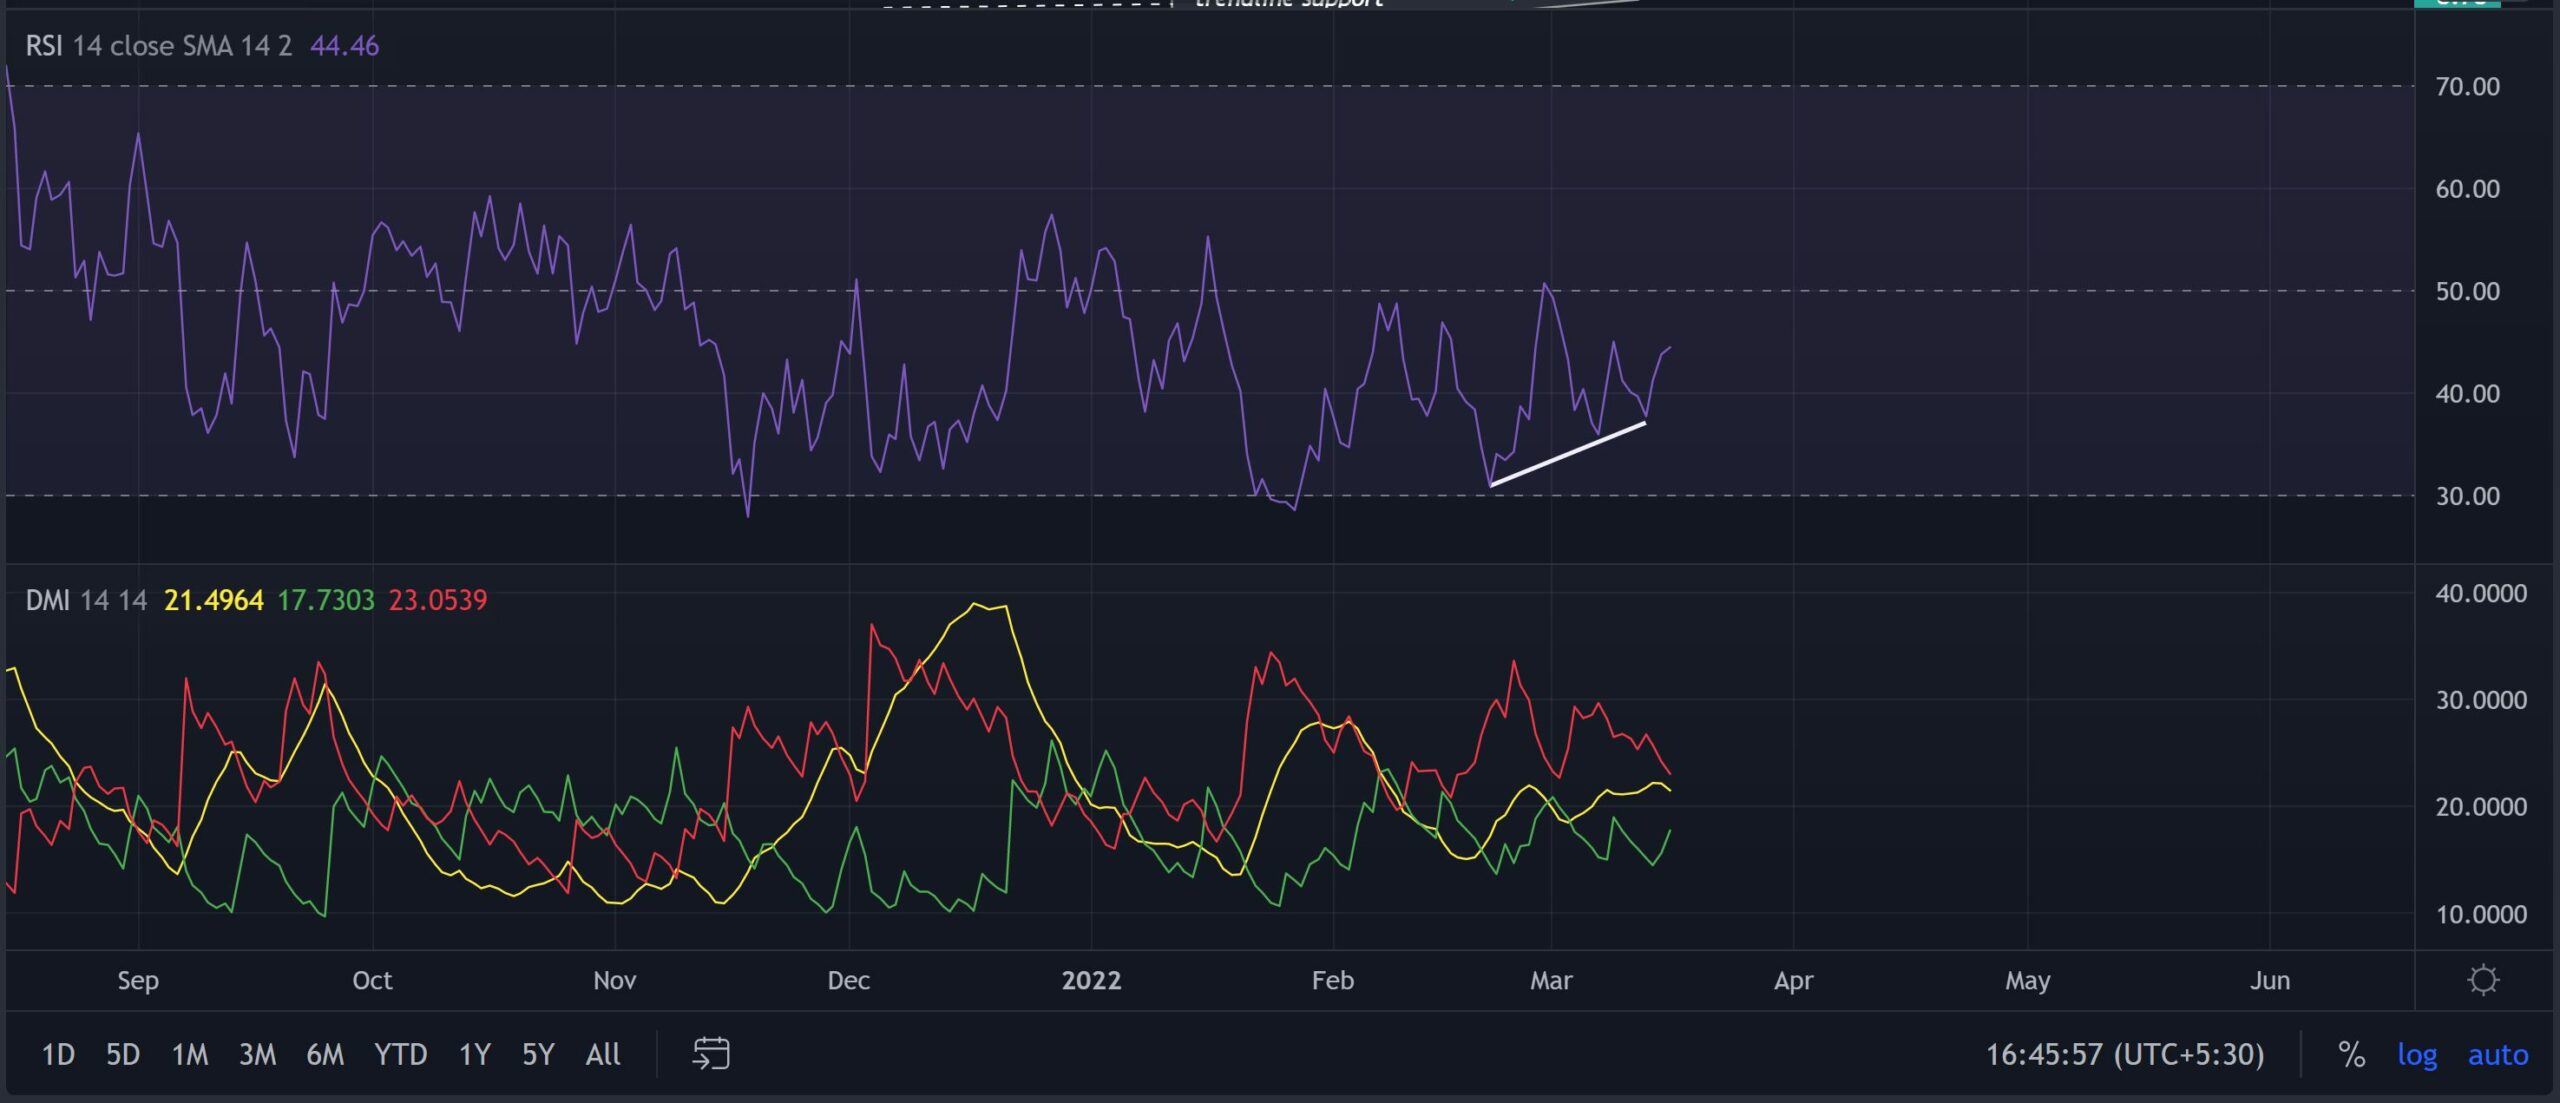
The RSI has been on an uptrend in the last three weeks while the price kept marking lower troughs. Thus, confirming a bullish divergence. Now, the chances of a midline retest are higher in the days to come.
Also, the gap between the DMI lines has improved in favor of the buyers. But a crossover was still due. With a weakened ADX (directional trend), the next few candlesticks would be critical to determine the patterned breakout chances.
Conclusion
After a recent bullish divergence and the improved buying influence on its technicals, UNI could see a break above its 20 EMA. In which case, a test towards the $9-$10 range would be probable before it conforms to its downtrend.
Besides, the alt shares a 77% 30-day correlation with the king coin. So keeping a close watch on Bitcoin’s movement would be inevitable to make a profitable move.