MATIC: Are there any perfect buy zones?

There’s no denying that the crypto-market has been hit pretty badly. As most of the market registered a sustained southbound trend, red candles took over most cryptocurrencies’ price charts. While most of the top 20 alts have been finishing in the red over the past week, one altcoin that truly stood out with its massive price losses was MATIC.
Post the 19 May drop, MATIC briefly recorded almost instant and rather strong weekly recoveries. However, that didn’t last long and the asset’s losses starting end of May have been constantly pulling its price down.
Over the past few weeks, the price structure of MATIC has appeared to be completely bearish, with the alt falling by almost 40% since the beginning of this month. Amid the crypto’s depreciating price, many hypotheses of ‘buying the dip’ and finding the right opportunity to enter the market have come up.
However, the question of ‘when to buy the dip’ and ‘what’s the perfect buy zone’ constantly persists. To understand the same, first, it’s important to understand where the market currently stands.
What do the metrics say?
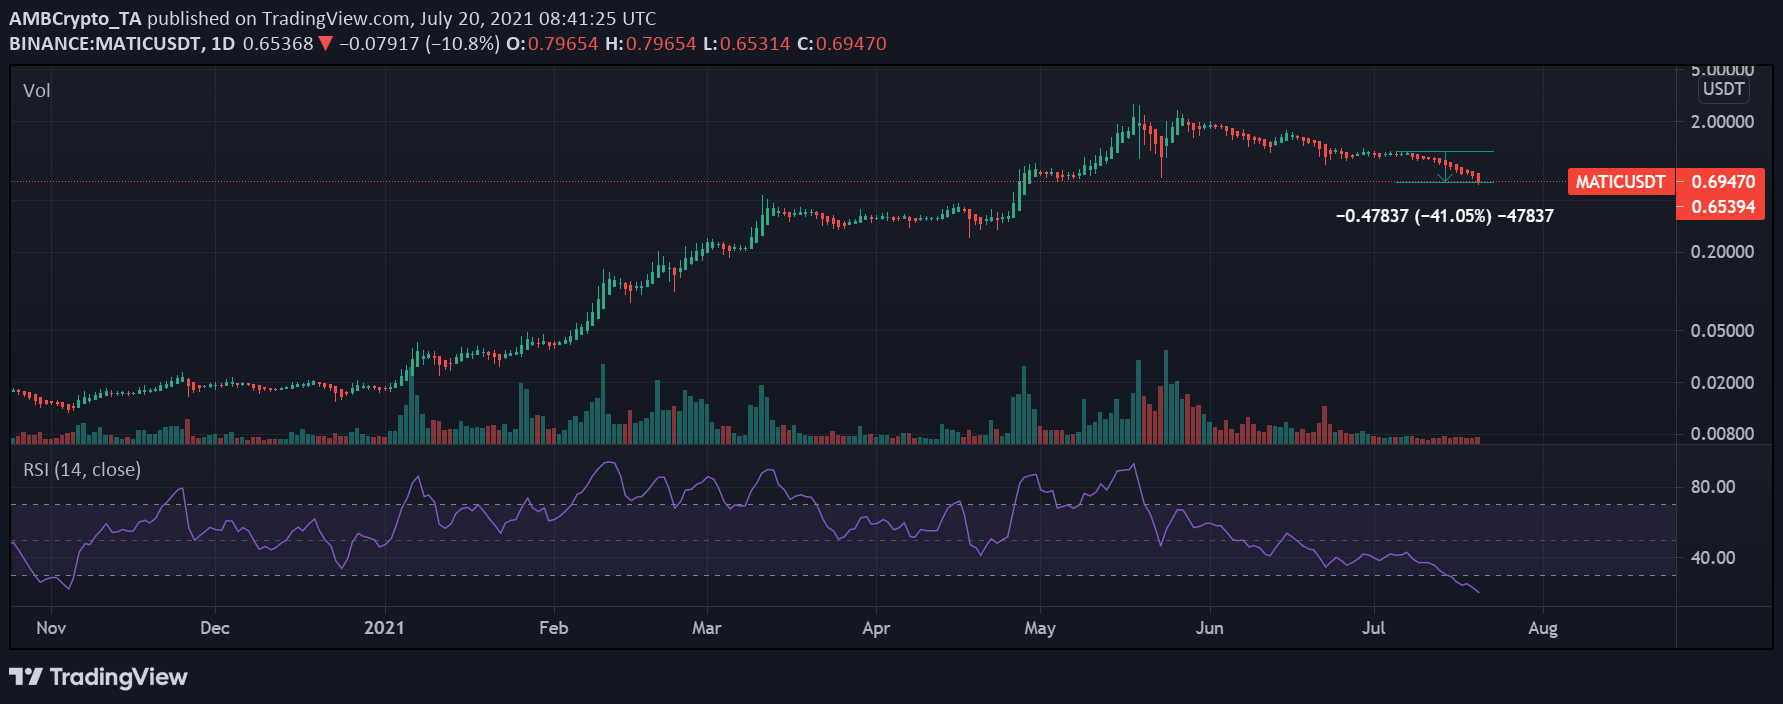
MATIC’s steep price fall triggered sell-offs that pushed the alt into the oversold zone on the one-day chart. Trade volumes for MATIC also registered shaky movement as the alt traded at $0.69 at press time, 74.07% down from its ATH of $2.5 in May.
Further, MATIC’s active addresses tested its April-end levels, having declined since the end of May and hitting a three-month low at the time of writing. The number of new addresses for MATIC also presented a decline. However, this wasn’t the worst bit as the alt’s mean transfer volume to exchanges for all exchanges highlighted all-time-low levels that presented a worrying picture for the altcoin.
Now, a previous analysis had underlined MATIC’s price and the DAA divergence which projected a strong bullish signal. Alas, it didn’t hold for long in front of other dominantly bearish trends.
What are the buy zones?
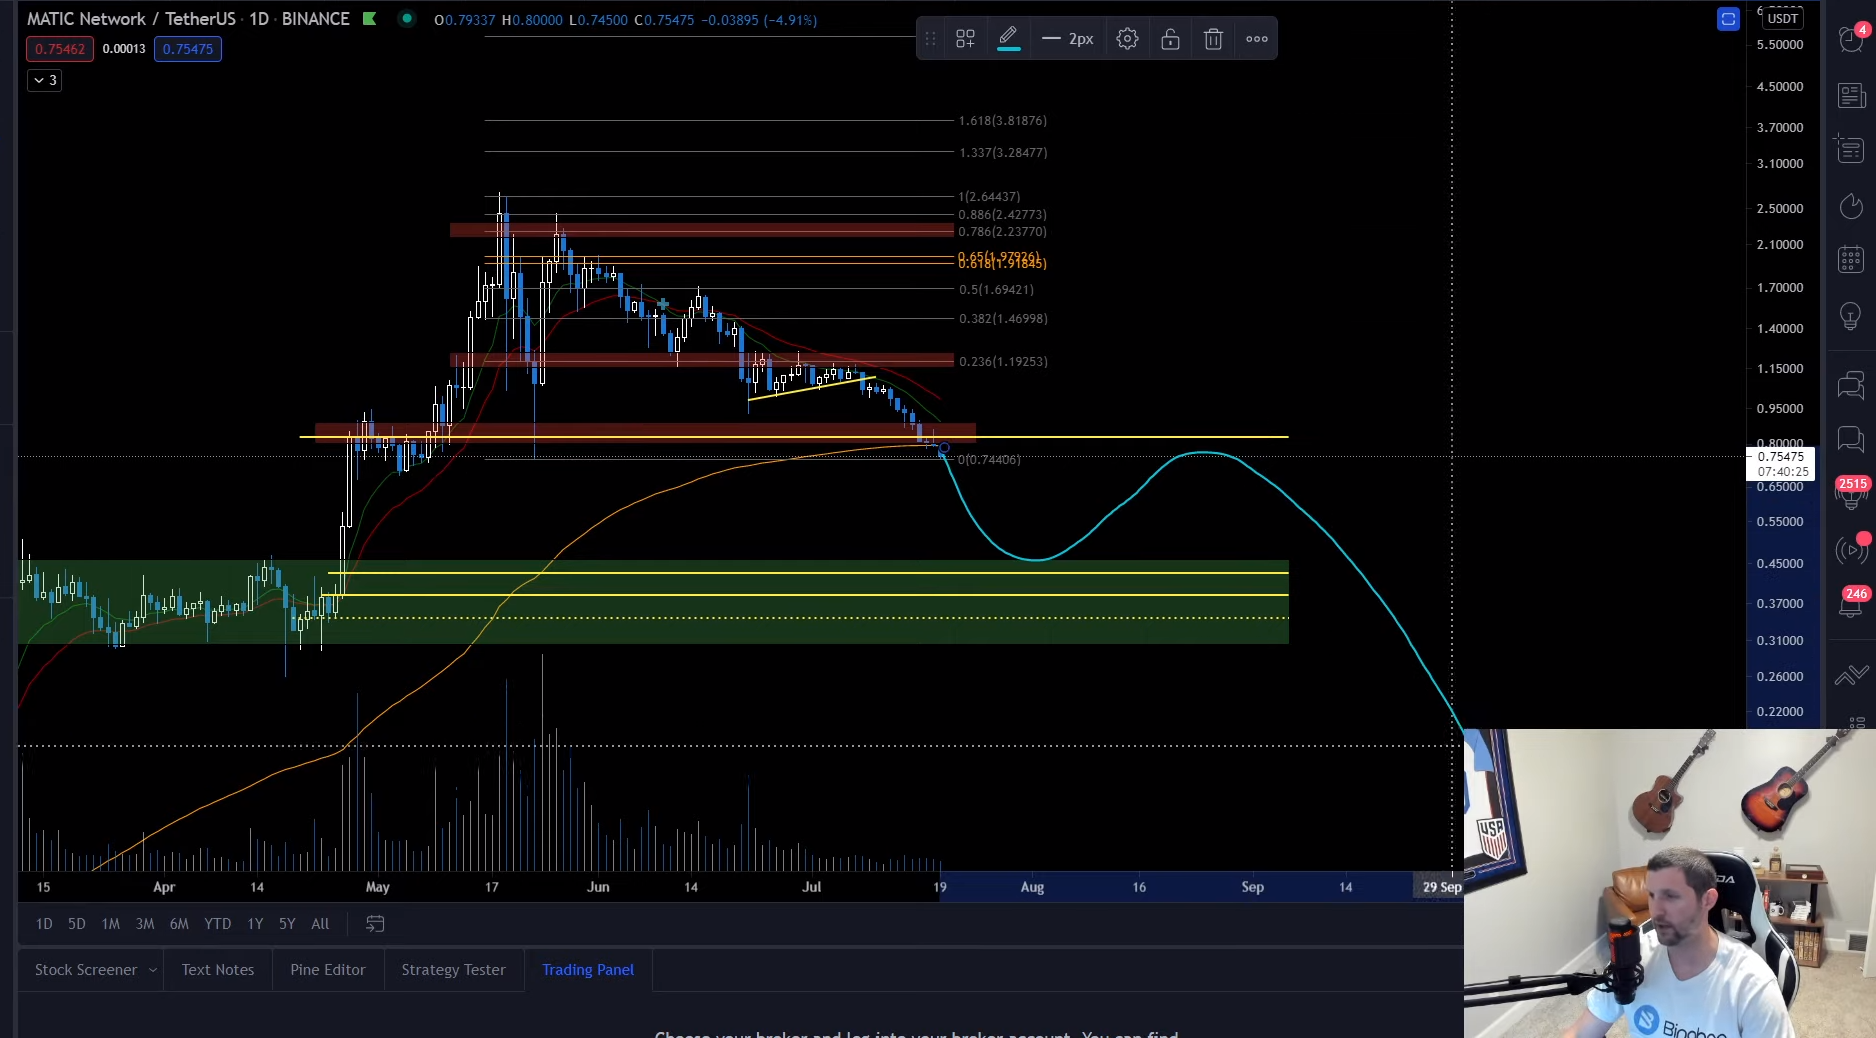
With the current picture for the alt presenting a bearish narrative as MATIC makes lower lows, when’s the right time to enter the market? According to analyst and trader Nebraskan Gooner, since MATIC has already flipped the $0.85 support to resistance, the next major support is at $0.45. That would be a good buy zone for short-term trades if the alt tests those levels, he went on to say. Taking about resistance to resistance trade, the analyst added,
“A lot of people don’t understand that, but it’s really nice to be able to (especially on Bitcoin) you can exit at a big resistance and get back in one to 2% higher with a good invalidation. A clear invalidation below good R to R is sometimes better than the risk potential of holding at resistance and watching it drop back.”
Gooner’s expectations from MATIC’s price don’t paint a very good picture for the altcoin in the coming days, especially since on-chain metrics seemed to support his argument.