MATIC, Chainlink and Monero Price Analysis: 15 August

With Bitcoin and Ethereum sliding down by 1.6% and 1.4% respectively, altcoins such as MATIC and Chainlink proceeded in the same direction. MATIC lost 2.2% and moved south towards the $1.36 support line, while LINK dipped after it failed to topple over the $27.77 resistance line. Finally, though Monero did not see declining prices, it flashed bearish signals on the chart.
MATIC
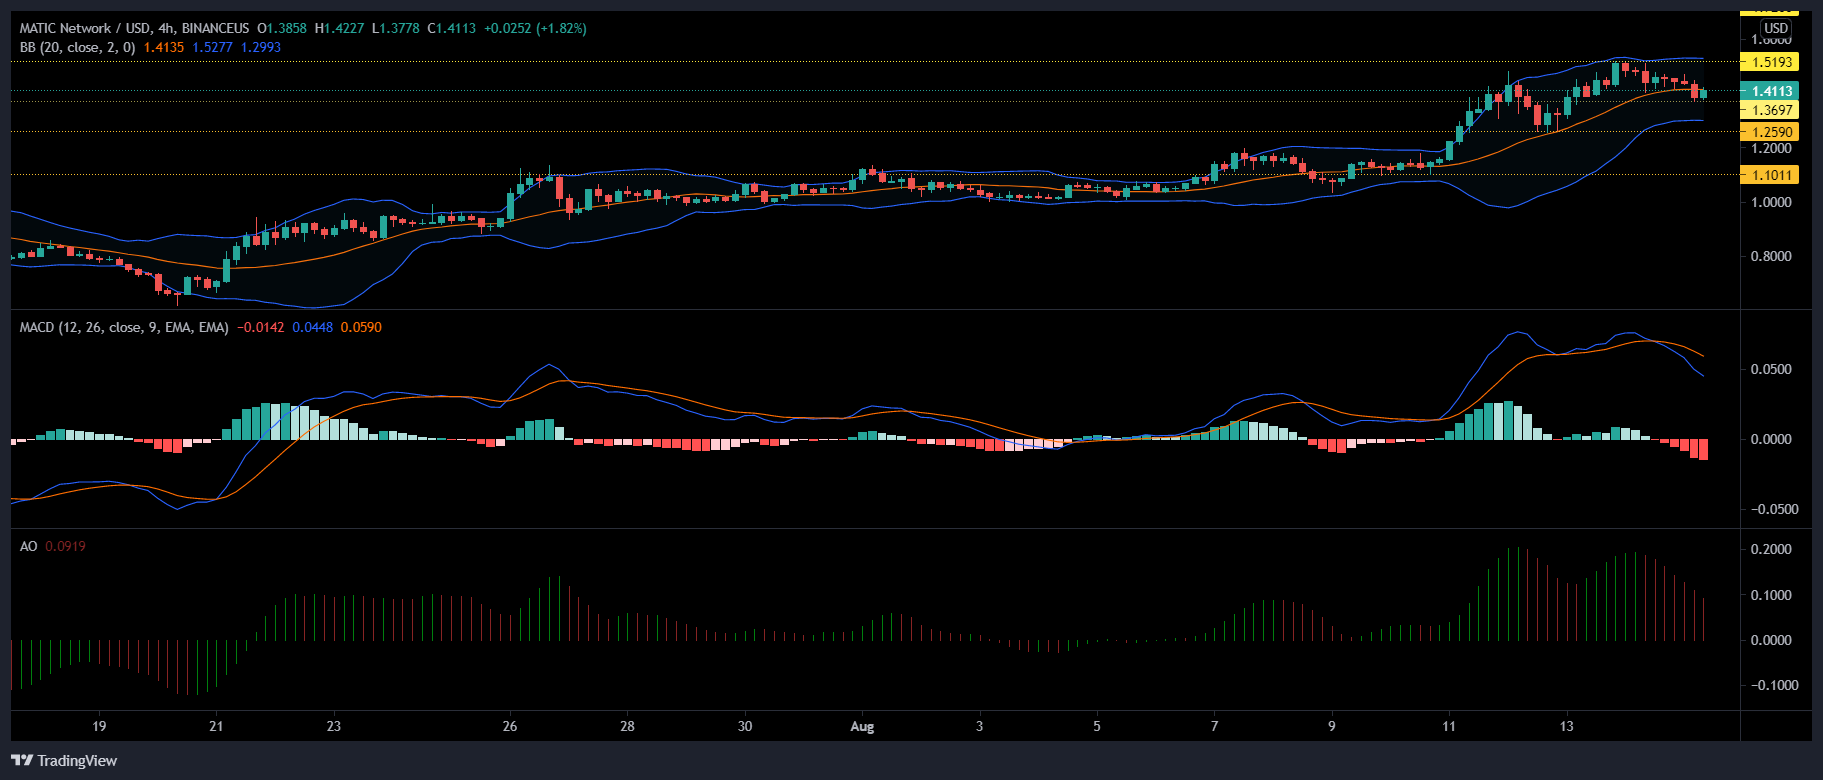
MATIC stood at $1.41 at press time. It had last touched this price level on 19 June. The alt’s retracement can result in it falling back on the immediate support level of $1.36.
Technicals pointed toward bearish movements on the chart. Awesome Oscillator flashed red signal bars and MACD also displayed red histograms beneath the half-line.
Bollinger Bands remained diverged and underlined the chances of an increase in market volatility over the upcoming trading sessions. On the upside, MATIC could potentially retest the resistance mark of $1.51.
Chainlink (LINK)
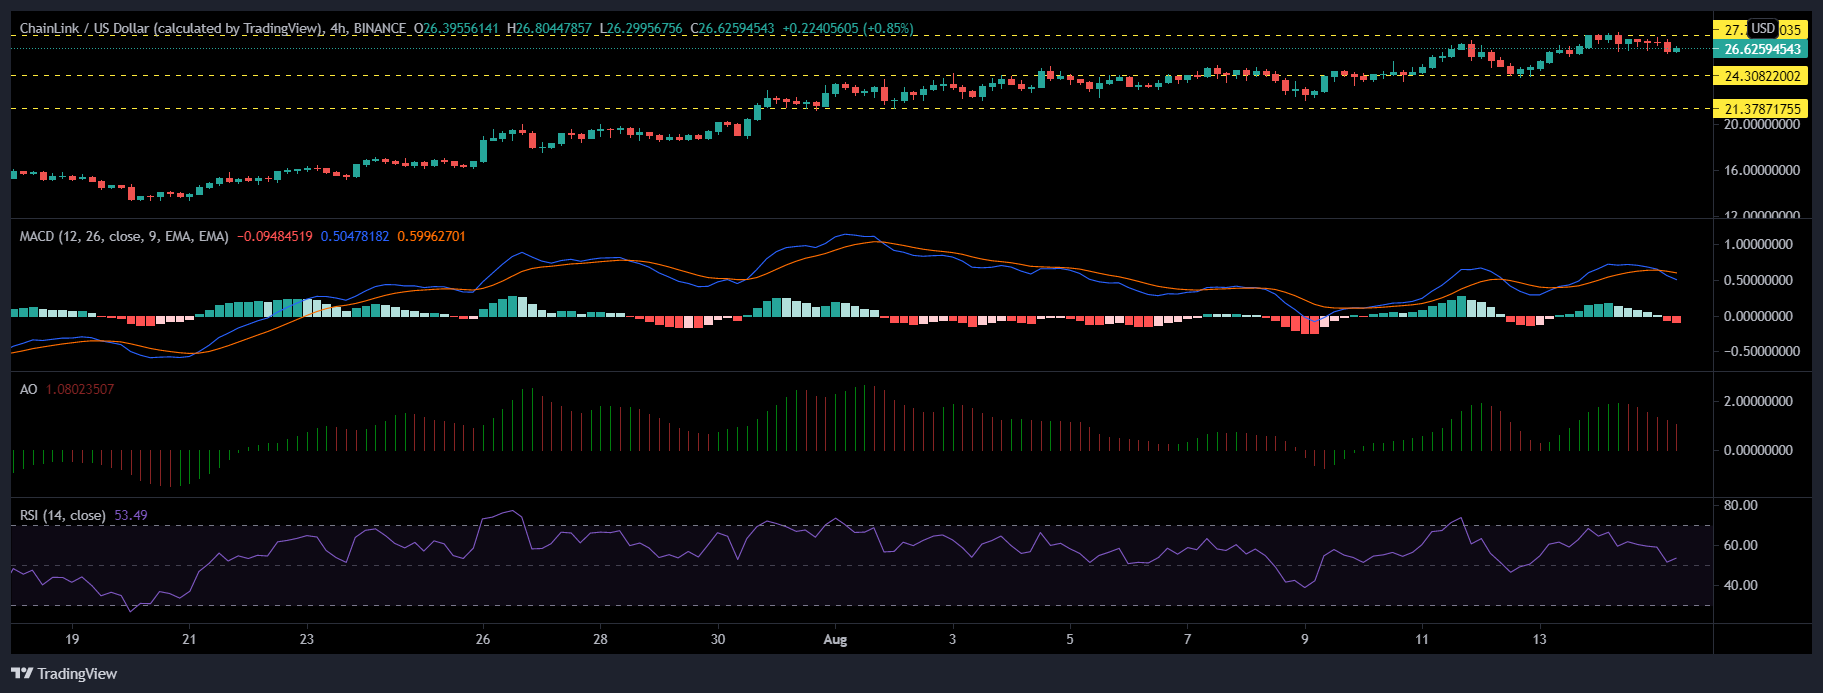
LINK retreated 0.6% since yesterday as the alt was valued at $26.82. The token declined after it failed to topple its $27.77 resistance line. In case of further retracement, LINK could fall on the $24.30 support region.
Awesome Oscillator flashed red signal bars and the MACD also displayed the onset of the red histograms beneath the half-line; indicating that LINK’s price movements were bearish.
Relative Strength Index, despite noting a fall in buying strength, remained above the half-line in the bullish zone. A price reversal could push LINK to retest the $27.77 resistance level.
Monero (XMR)
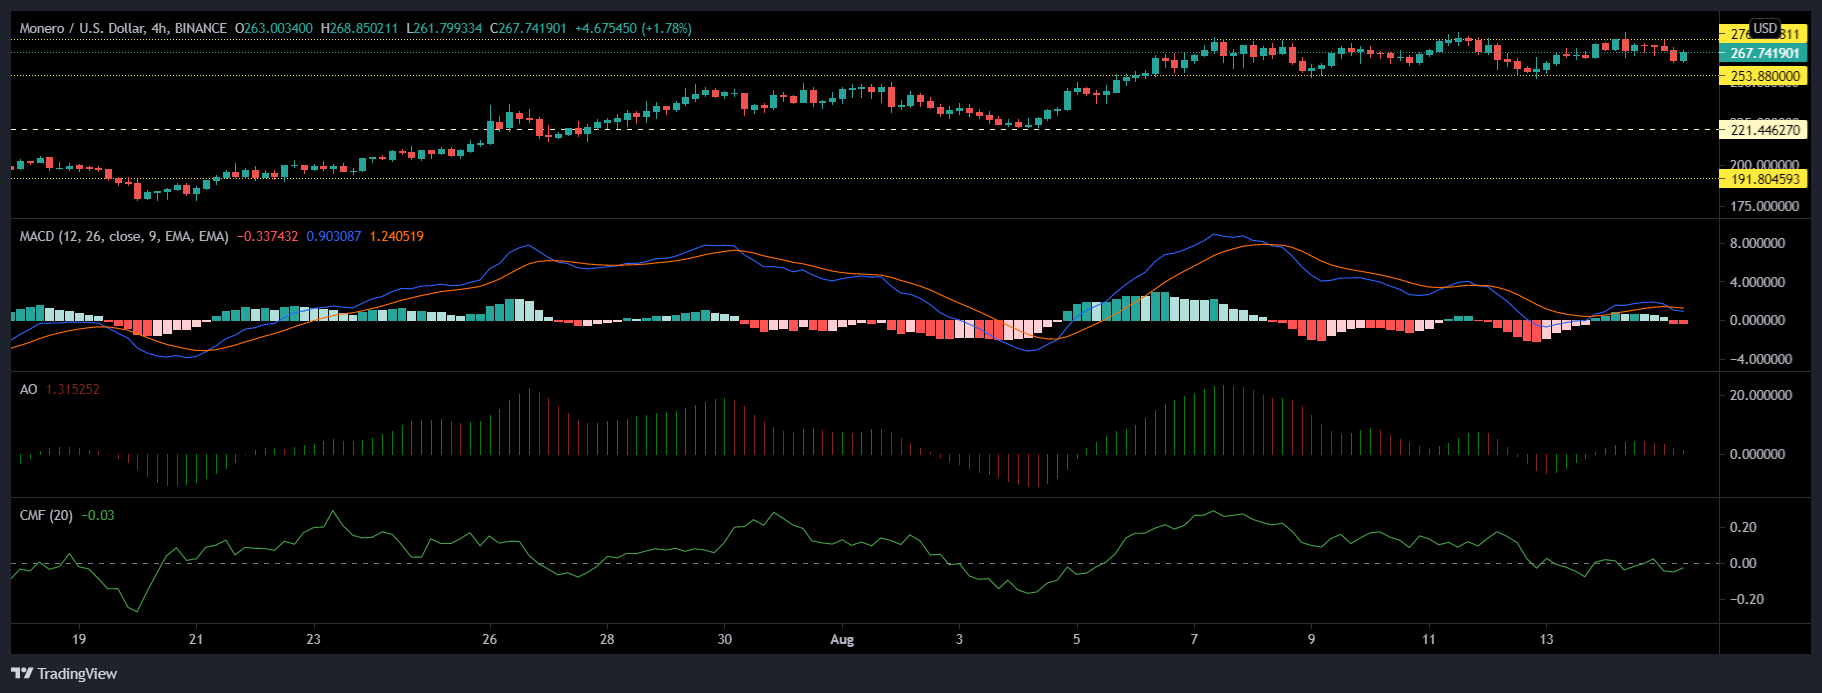
XMR depicted price consolidation, as it traded within the range of $276.12 and $253.80 respectively. The charts, however, pointed towards bearish sentiments in the market.
MACD noted a bearish divergence followed by displaying red histograms and the Awesome Oscillator too, noted red signal bars. Chaikin Money Flow fell below the half-line, after it recorded a dip in capital inflows over outflows.
If prices retreat, the support line for XMR will be at $253.88 and in case of a rise, the coin could test the $276.12 resistance level for the fourth time in one month.