MATIC, Chainlink, SAND Price Analysis: 27 February

While the fear sentiment failed to improve over the last 24 hours, MATIC hovered near its Point of Control and saw a clash between its buyers and sellers around the $1.5-zone.
On the contrary, Chainlink and SAND saw patterned breakouts but still struggled to topple their immediate resistances to claim a healthy rally.
Polygon (MATIC)
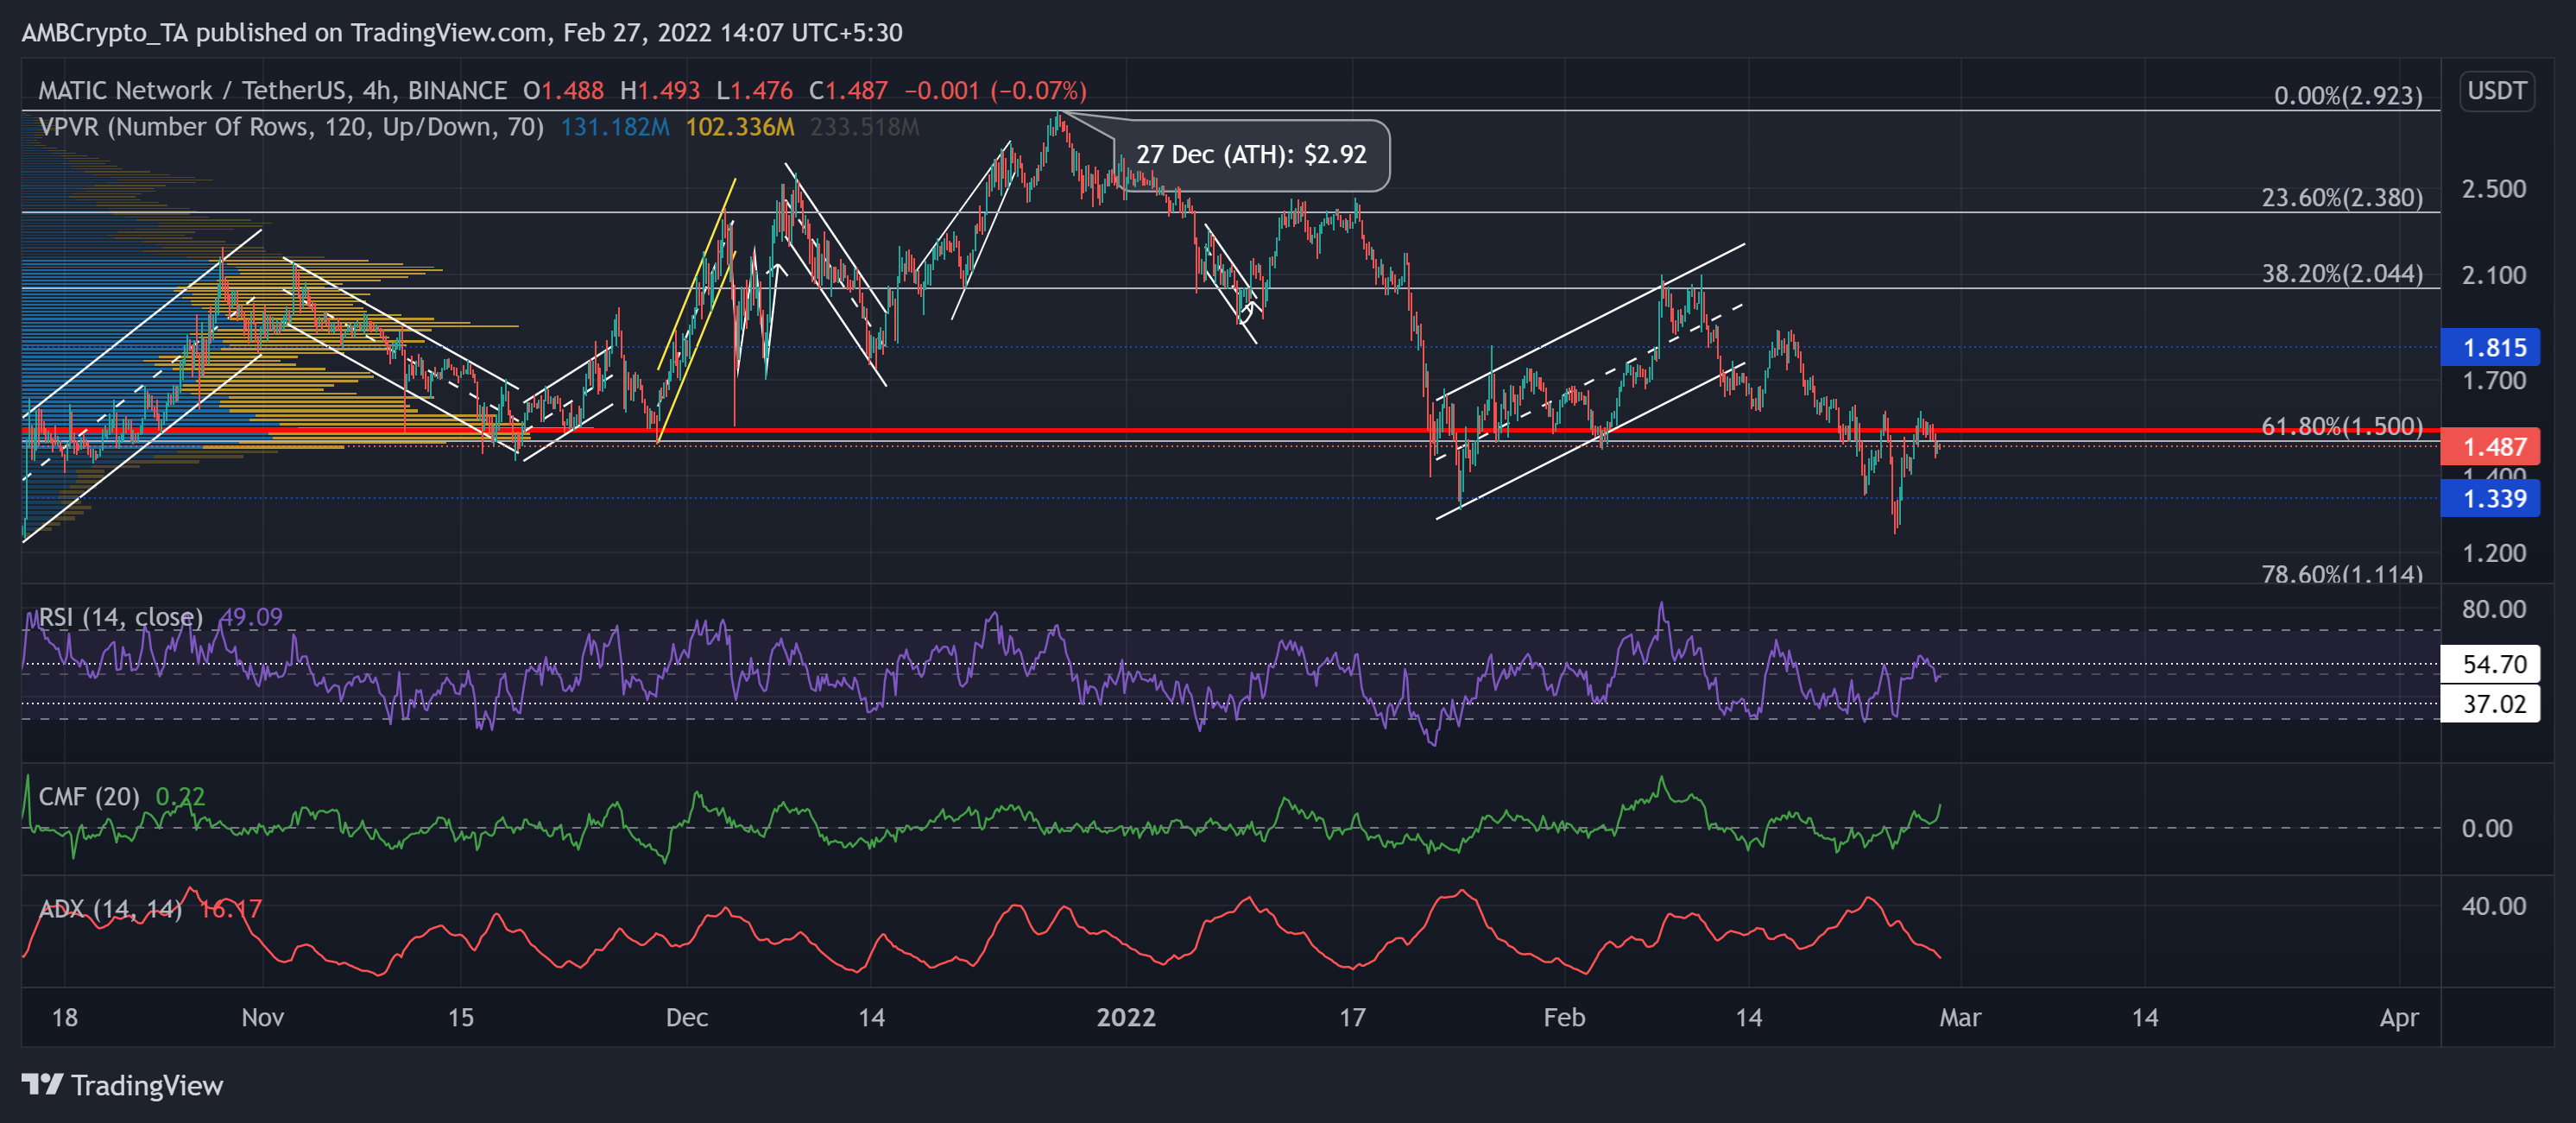
From its ATH on 27 December at $2.92, MATIC fell to witness a 54.24% decline and hit its three-month low on 24 January. But, the bulls quickly stepped in at the $1.3-mark as it saw a 58.6% ROI until 10 February.
However, since then, the bears took over while bulls failed to defend the vital Point of control (POC, red) in the $1.5-zone. This zone also coincided with the 61.8% Fibonacci support. As the $1.3-support stood sturdy, MATIC found an oscillation range between $1.3 and $1.5. The bulls need to increase their thrust to breach the POC and reclaim the golden support level.
At press time, MATIC was trading at $1.487. The RSI steeply surged from the oversold region. Any recovery from here would find a ceiling at 54 for testing. Furthermore, the CMF displayed a bullish bias as it looked north. Even so, the ADX was on a downtrend and affirmed a weak directional trend.
Chainlink (LINK)
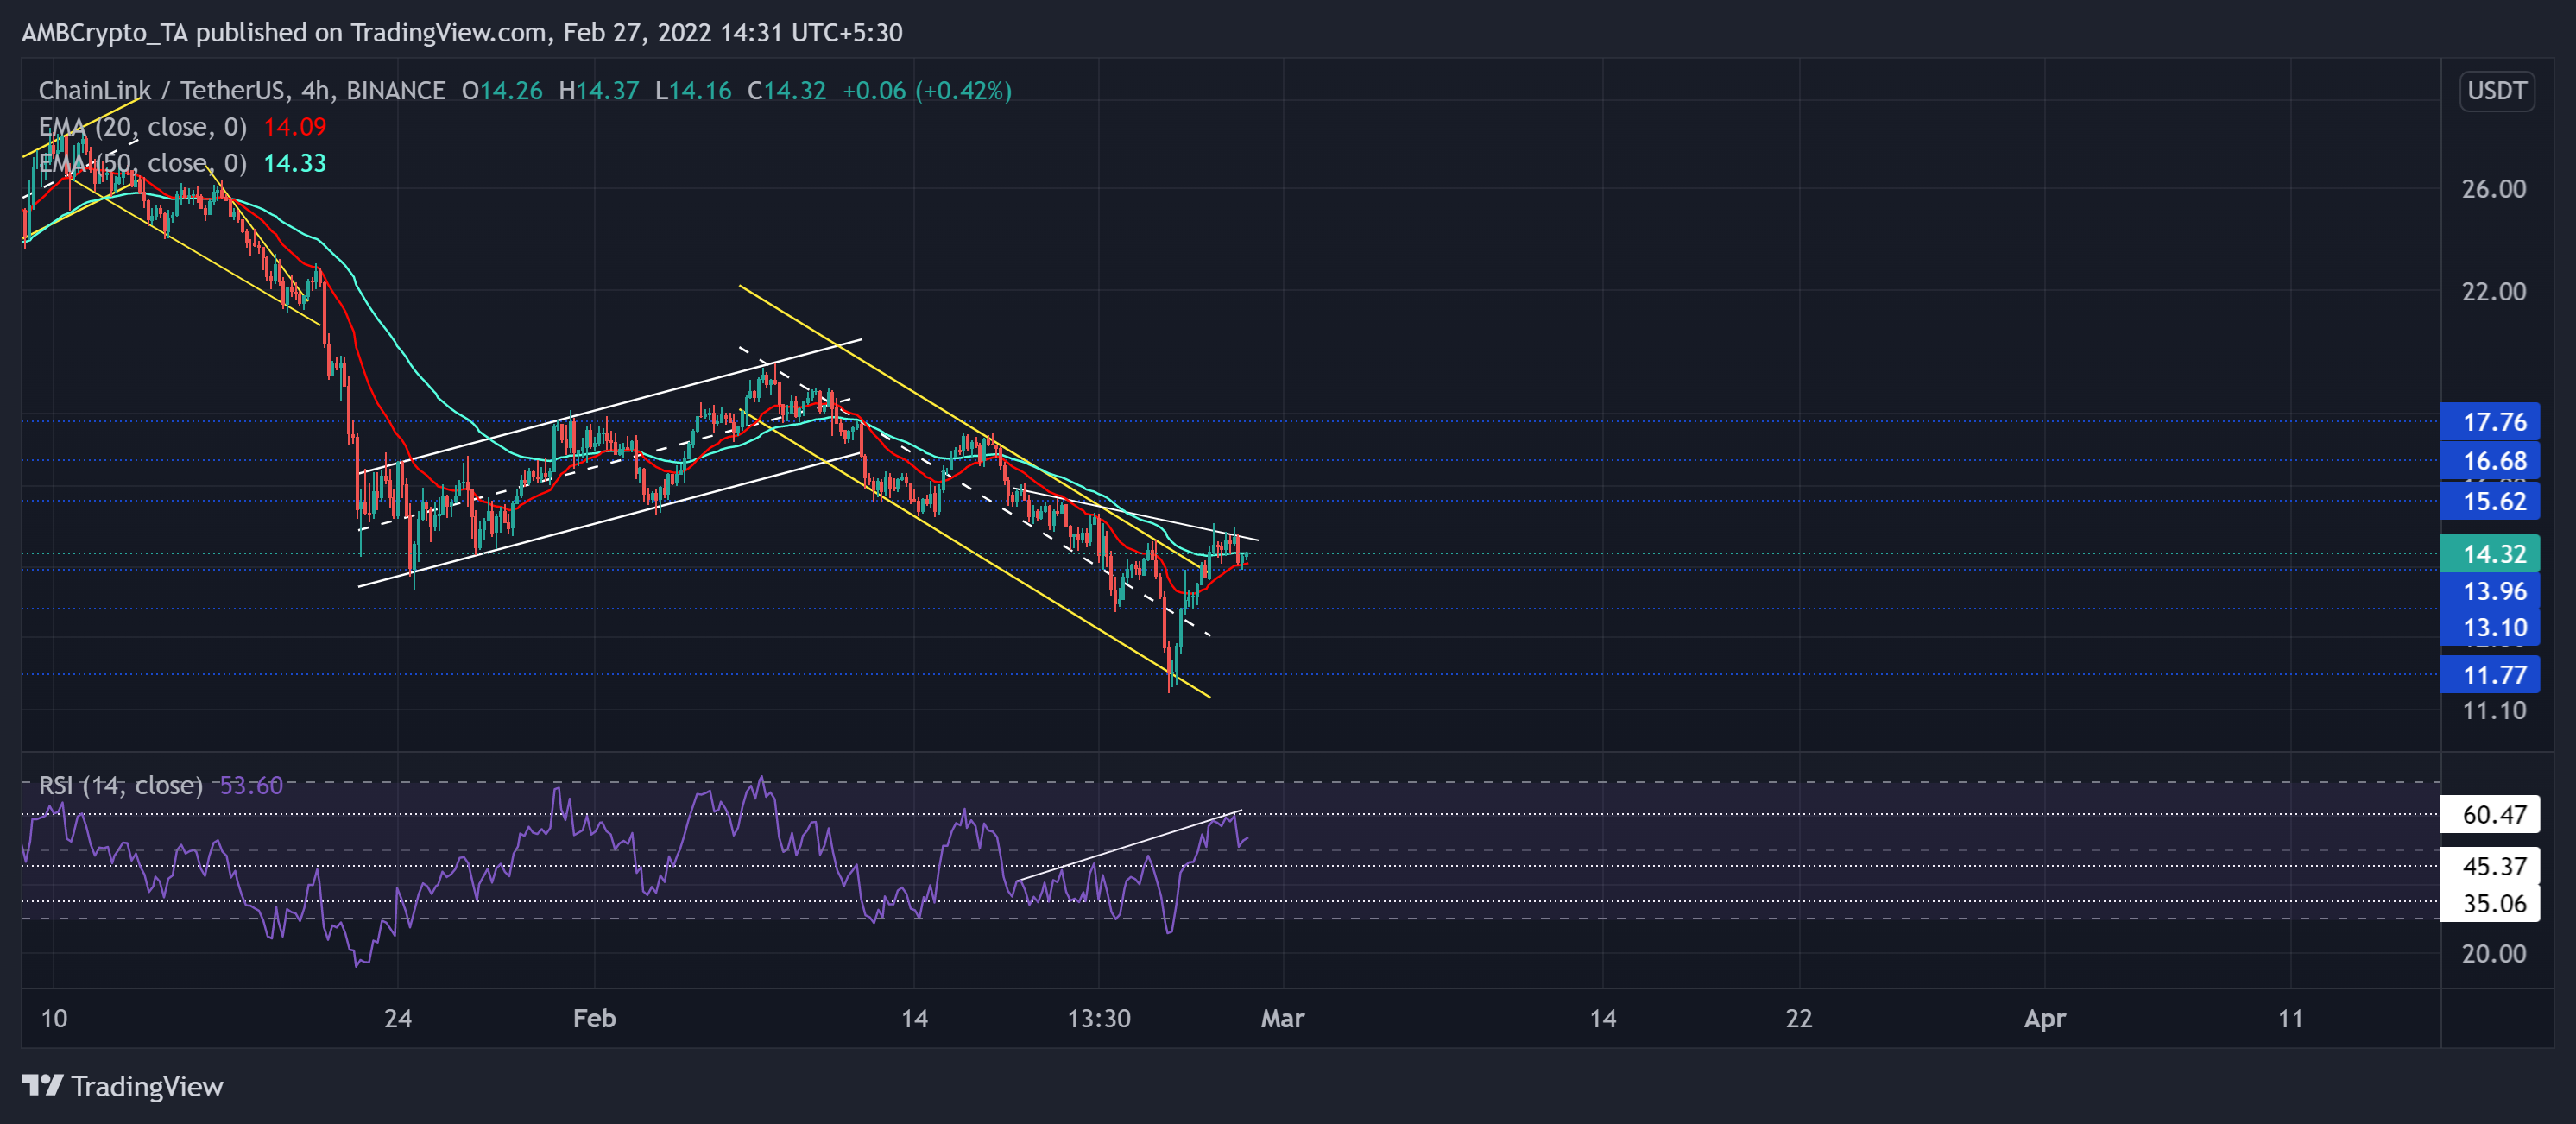
The selling pressure heightened after the up-channel (white) breakdown after the bears took over and pierced through crucial price points.
As a result, LINK plunged to hit its 14-month low on 24 February. However, the bulls finally showed up at the $11.7-mark as the alt recorded over 23.08% gains in the last three days. Thus, the altcoin managed to find a close above its 20 EMA (red) and endeavored to overturn the 50 EMA (cyan).
At press time, LINK traded at $14.32. After testing the midline support two times in the last three days, the RSI revealed a bullish edge. Any close below the white trendline would affirm the existence of a hidden bearish divergence.
The Sandbox (SAND)

The previous uptrend saw exceptional gains as the altcoin poked the $4.8-resistance and tested the three-week trendline support (yellow, dashed).
As the bears started to gain momentum, they breached this support and flipped it to resistance. Meanwhile, SAND noted a 45.7% decline as it touched its January lows on 24 February. After its recent gains, it did break out of the channel but saw a strong rejection of higher prices at the $3.19-level.
At press time, SAND traded at $3. RSI‘s recent revival managed to cross the midline but it was soon to fall towards the 35-mark. Also, the DMI flashed a bearish advantage while the ADX pictured a weak directional trend.