MATIC, Cosmos, Bitcoin Cash Price Analysis: 13 January

Interestingly, the crypto fear and greed index plunged by a point over the past day while the market entered into the green zone. This reading meant that the recovery still failed to alter broader sentiment.
MATIC saw a double-digit recovery from its 11-week Point of Control and reclaimed the 61.8% level. Further, Cosmos and Bitcoin Cash crossed their near-term SMAs but failed to ramp up convincing volumes.
Polygon (MATIC)
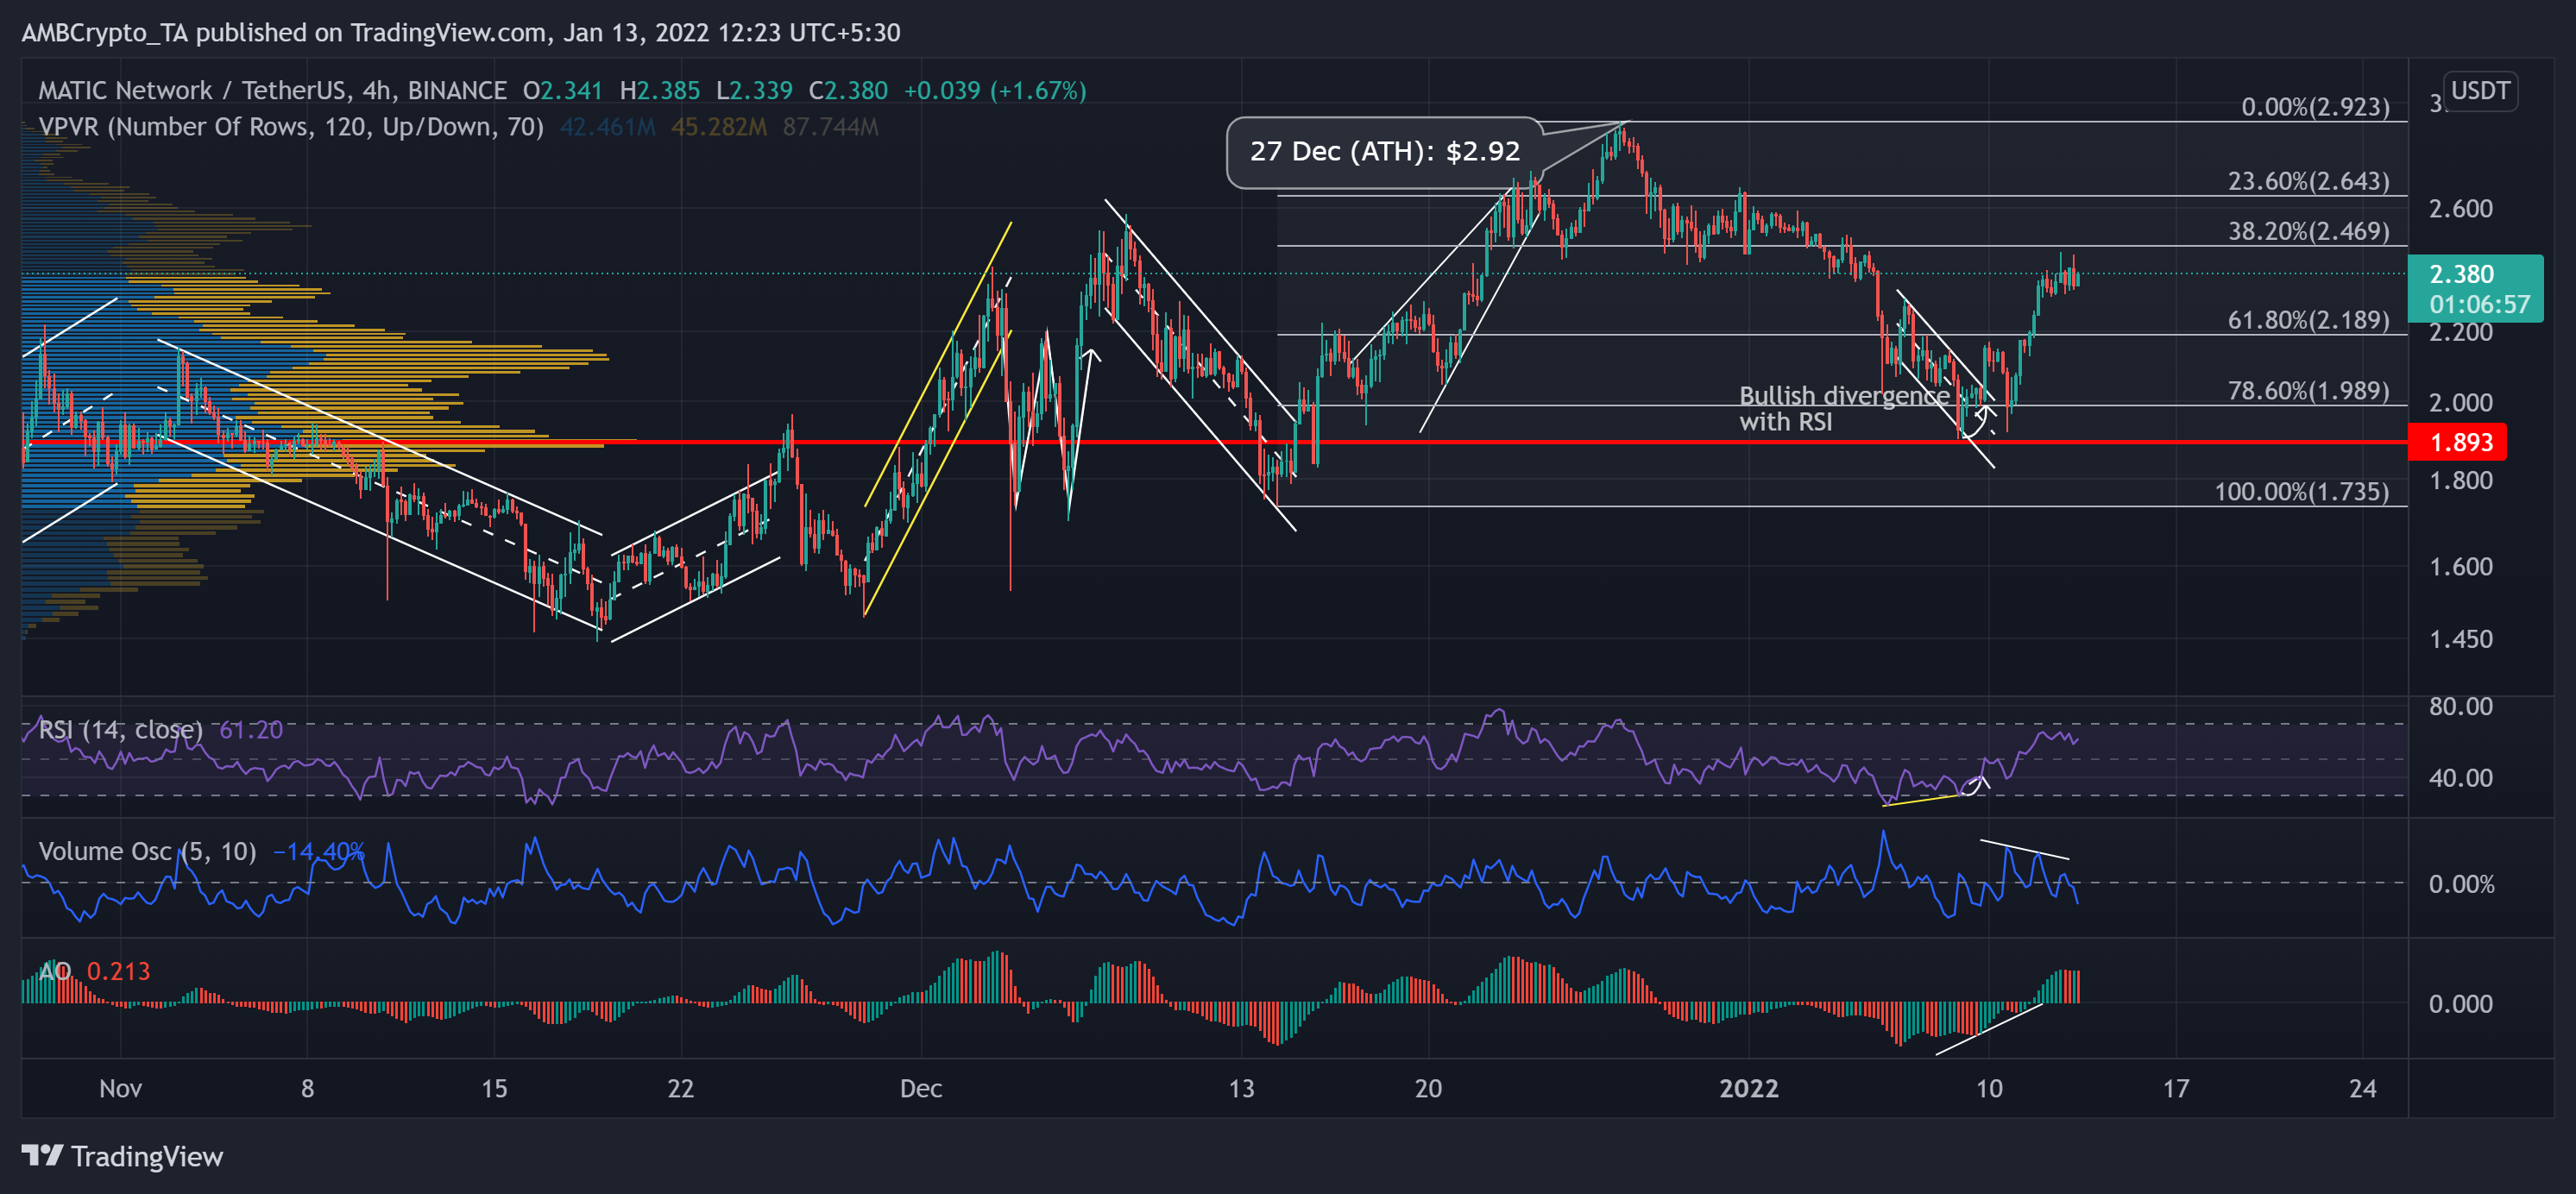
After striking its ATH on 27 December at $2.92, MATIC withdrew and registered a 34.7% decline until it poked its monthly low on 8 January. The fall tested the 38.2% Fibonacci support multiple times, but this area failed to offer high liquidity.
MATIC saw a 25.2% ROI in just the last five days after bouncing back from its 11-week Point of Control (red). Thus, it eventually reclaimed the 61.8%, 78.6% support levels after losing them.
At press time, MATIC at $2.38. The RSI saw a 32 point surge in the last three days after a bullish divergence with the price. Thus, it finally crossed the half-line and exhibited a bullish preference.
Further, the AO jumped above the half-line after seeing bullish twin peaks below the equilibrium. However, the Volume Oscillator marked lower peaks, hinting at a weak bullish move.
Cosmos (ATOM)
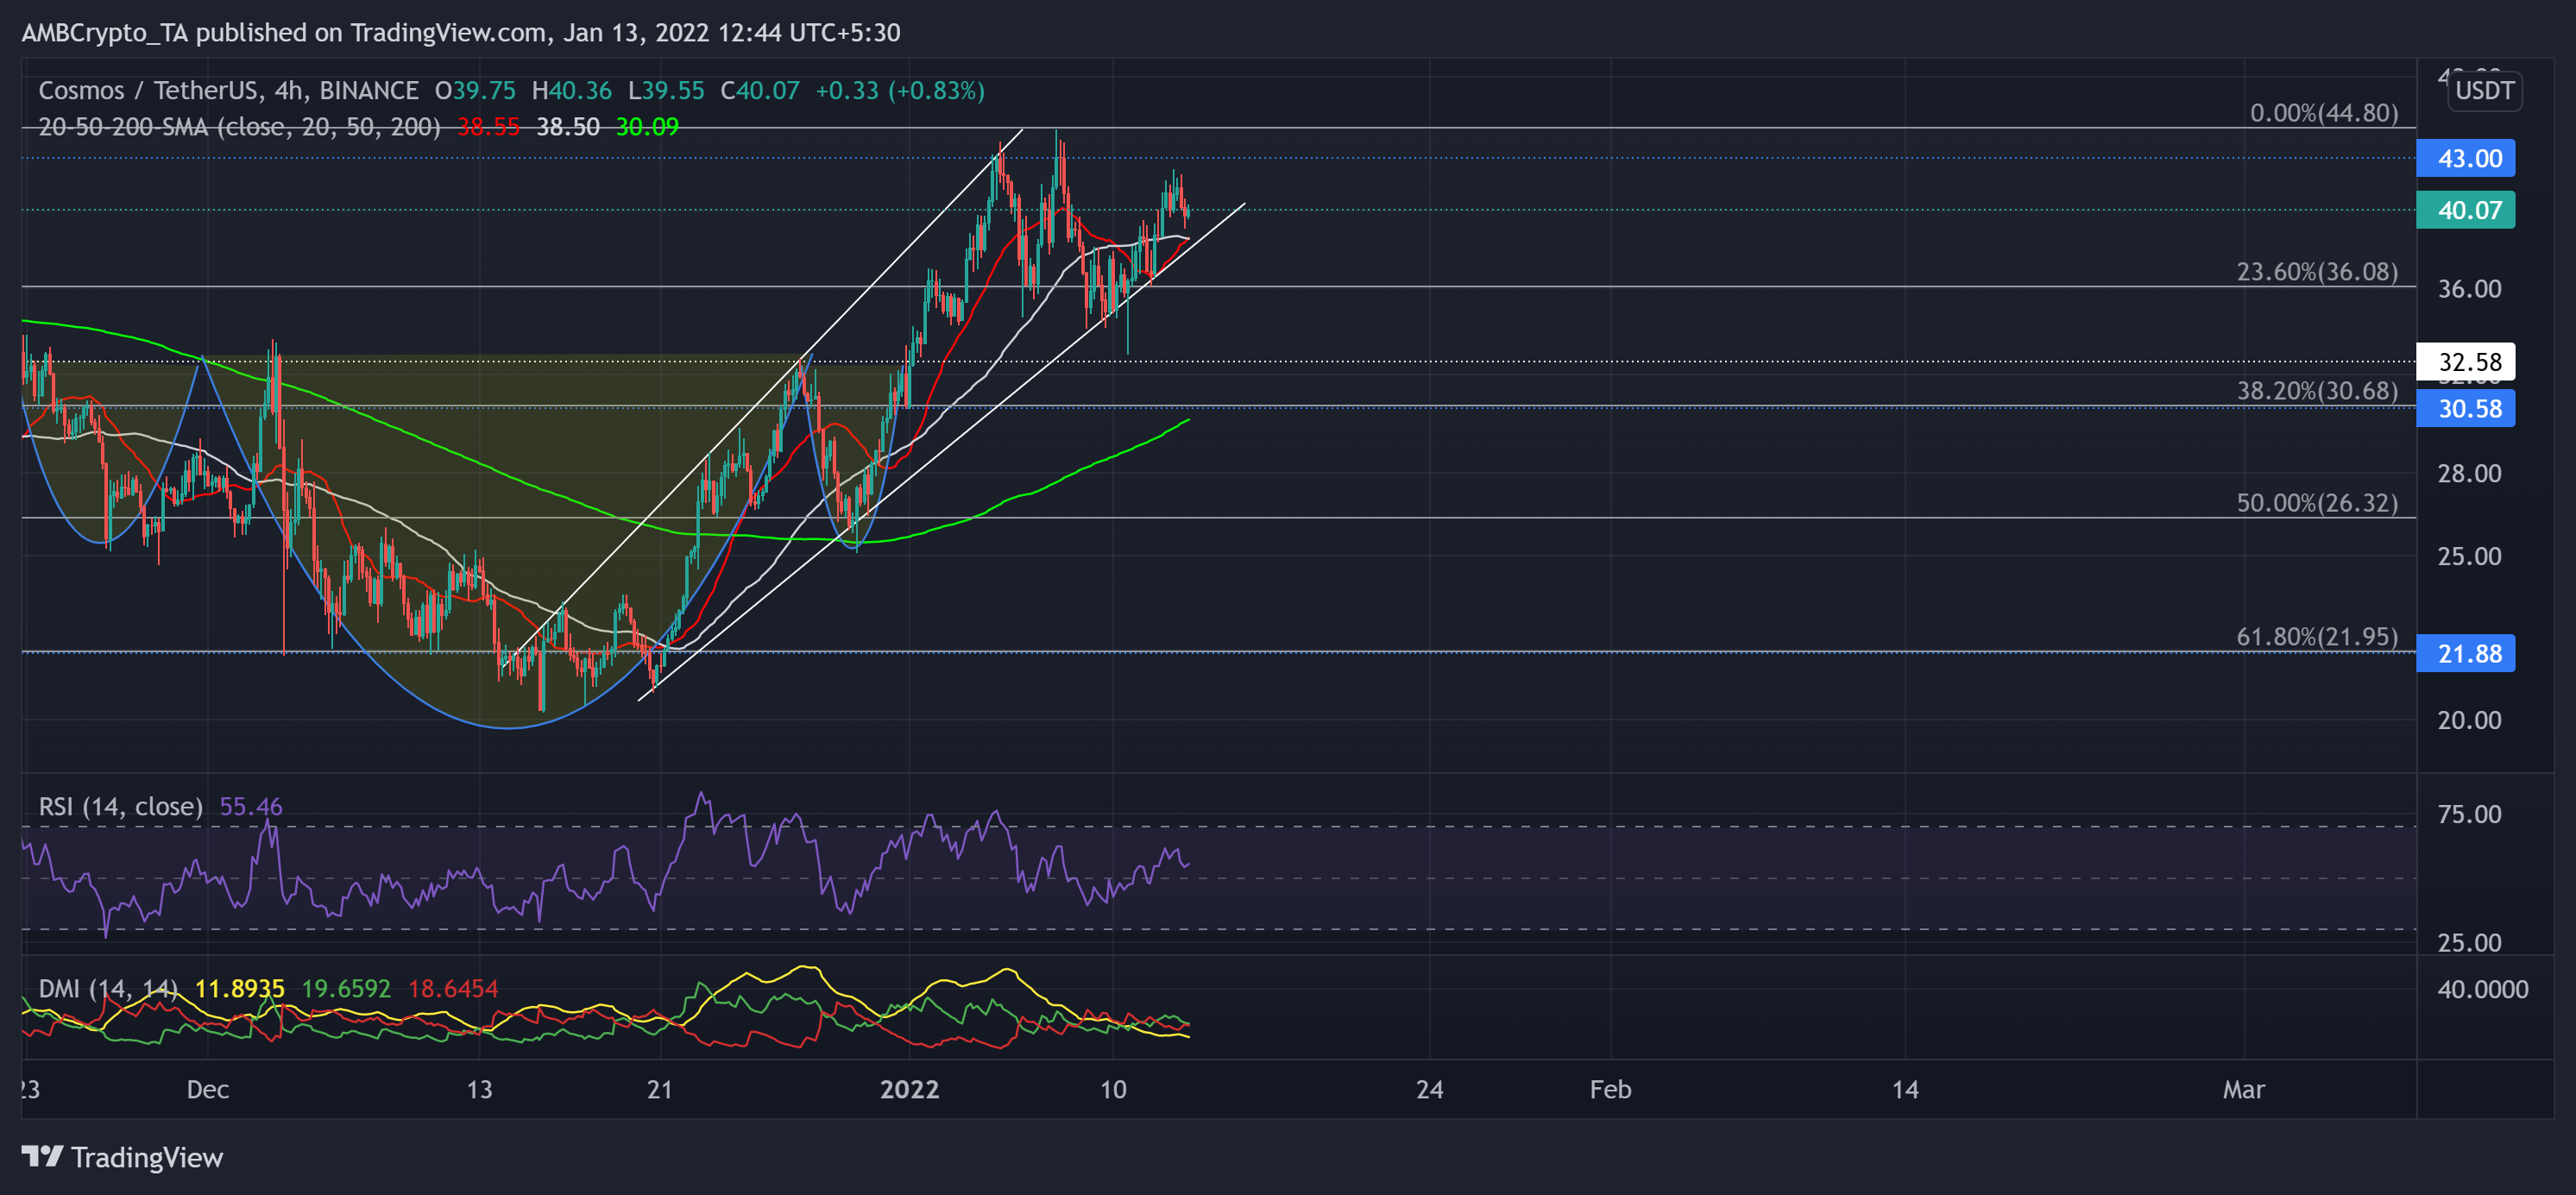
The alt jumped by over 35% (from 1 January) and poked its 15-week high on 7 January. This incline helped ATOM reclaim its long-term 23.6% Fibonacci support at the $36-mark.
After retesting the $32.5-support for over seven weeks, the bulls finally initiated a sustained breakout for the past four days. With this rally, the alt formed an ascending broadening wedge over the past month.
Now, as the 20 SMA (red) and the 50 SMA (grey) saw a bullish crossover, it depicted an increased buying influence.
At press time, ATOM traded at $40.07. The RSI consistently marked higher peaks and jumped above the midline. Further, the DMI too flashed a bullish bias the ADX displayed a weak directional trend.
Bitcoin Cash (BCH)
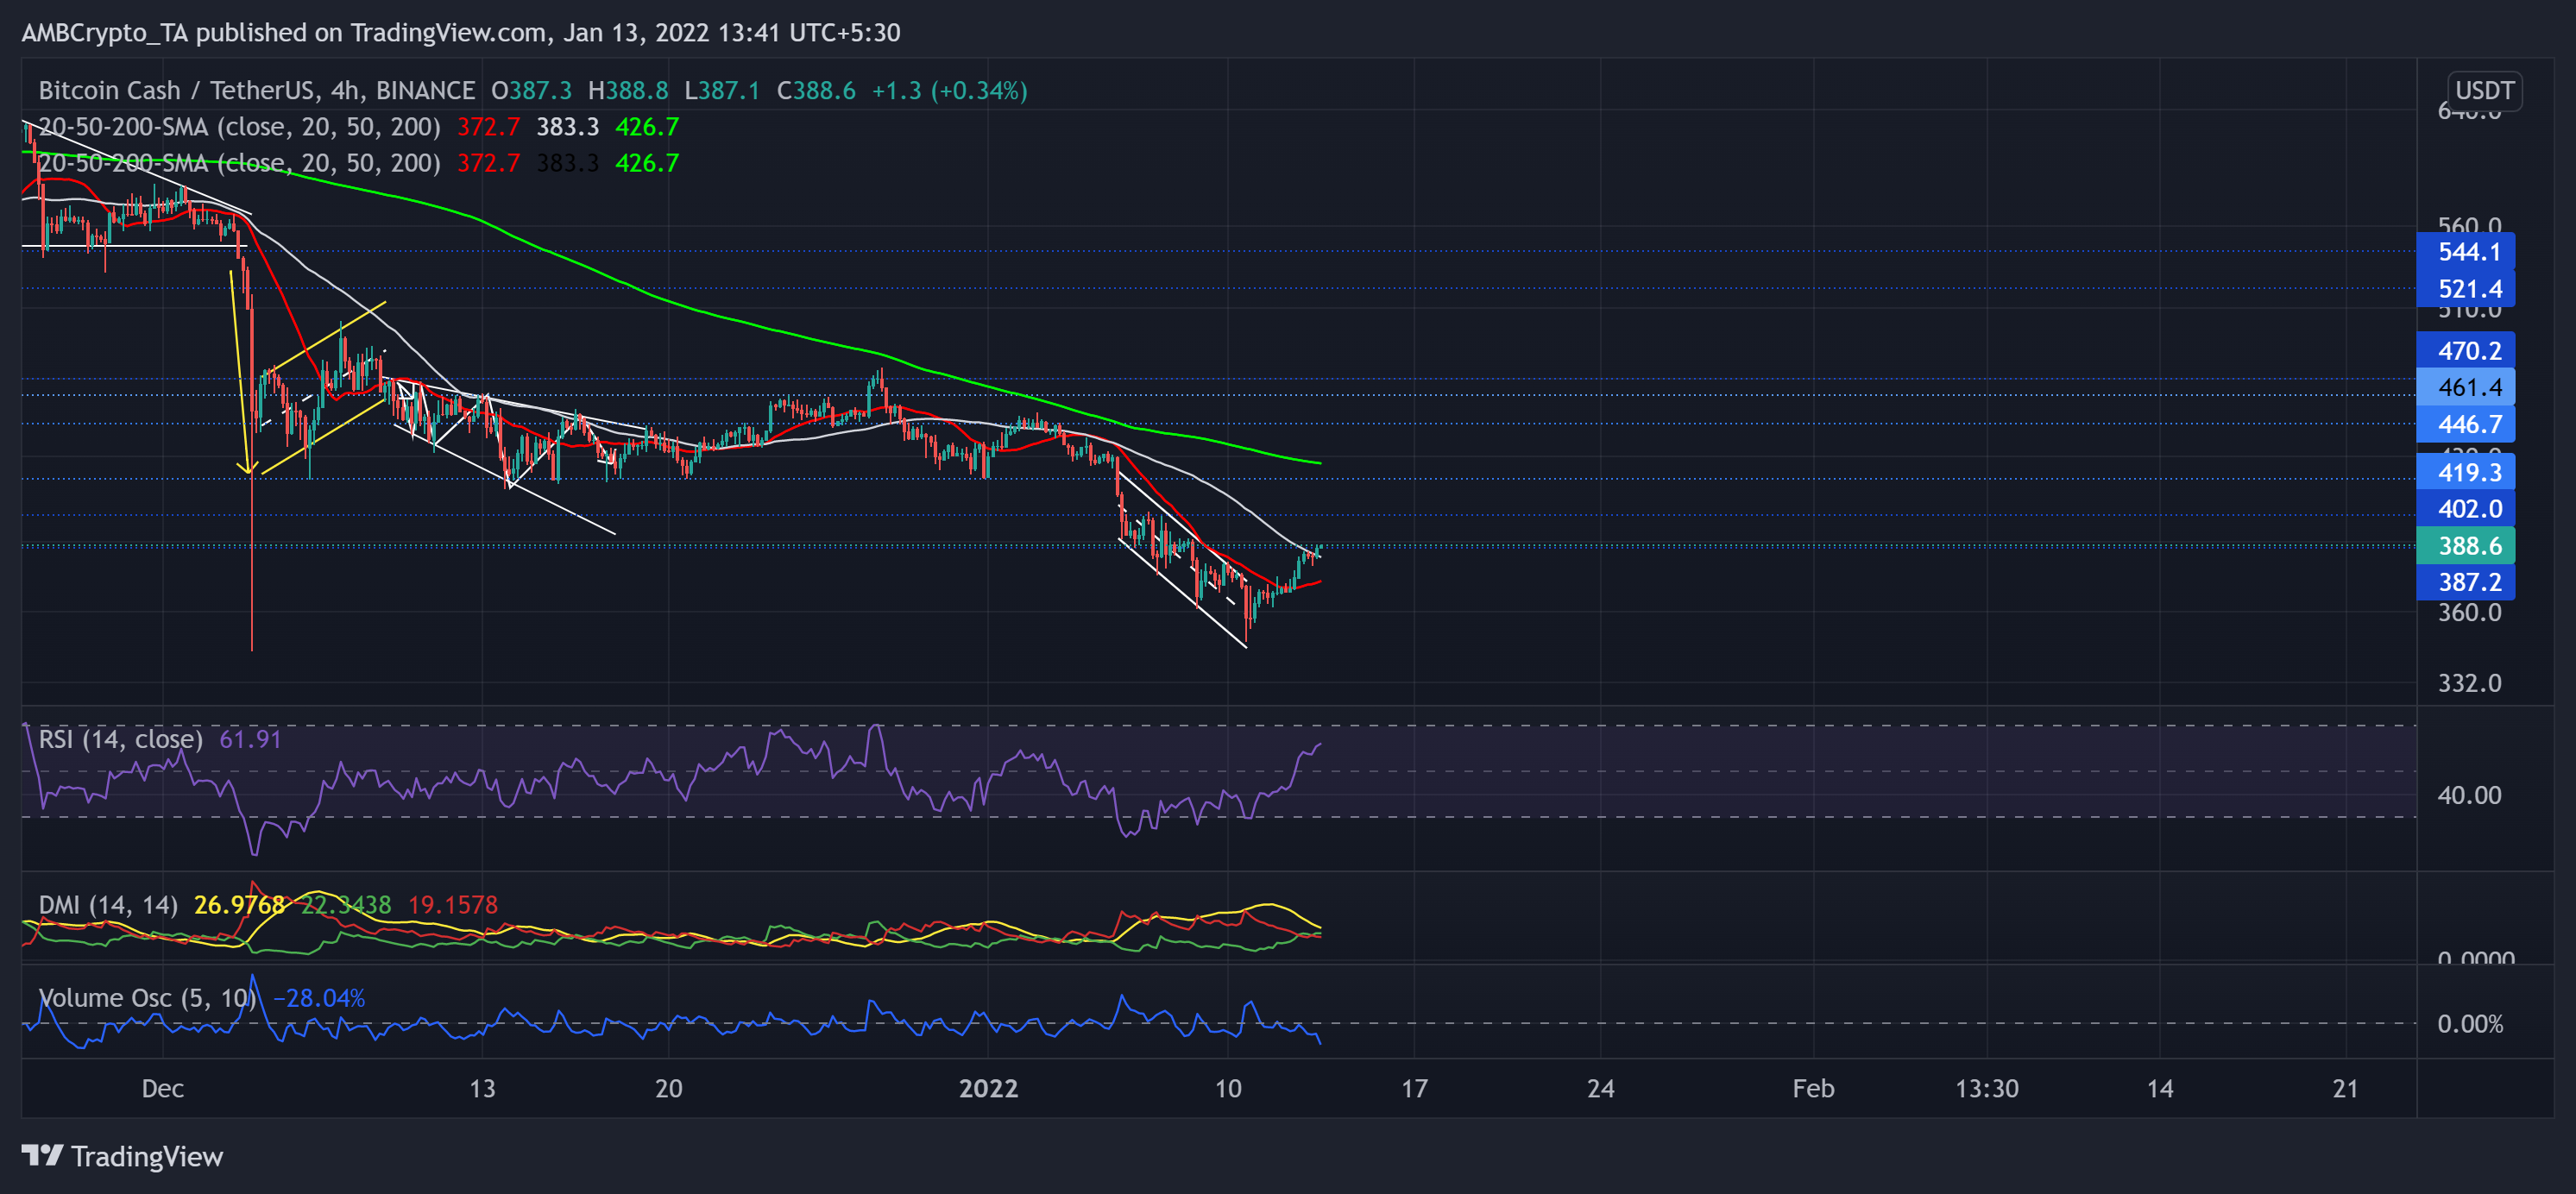
The bulls failed to uphold the crucial $419-support while bears retested it multiple times. The price action saw a sustained dip below this level for the first time in over a year now.
BCH saw a patterned breakout of the down-channel after poking its five-week low on 10 January. The alt saw over 10% gains in the last three days and reclaimed the $387-support. The immediate testing level for the bulls stood at the $402-level.
At press time, BCH traded above its 20-50 SMA at $388.6. The RSI was northbound and eyed to test the overbought region. Also, the DMI lines undertook a bullish crossover. But the Volume Oscillator plunged, indicating a weak bull move.


