MATIC faces rejection at $1.25, a revisit of $1 looks increasingly likely

Disclaimer: The information presented does not constitute financial, investment, trading, or other types of advice and is solely the writer’s opinion.
- The daily market structure was bearish.
- The bounce from the Fibonacci golden pocket gives bulls hope for further gains.
Polygon [MATIC] saw a massive price appreciation earlier this year. A good chunk of those gains has been wiped out over the past three weeks. The NFT ecosystem of the blockchain was thriving despite the shift in sentiment.
Read Polygon’s [MATIC] Price Prediction 2023-24
The launch of the Polygon zkEVM is just a week away and anticipation was building up at press time. It remains to be seen if the event will have a strong impact on the price charts.
The resistance zone at $1.25 has refused to yield so far
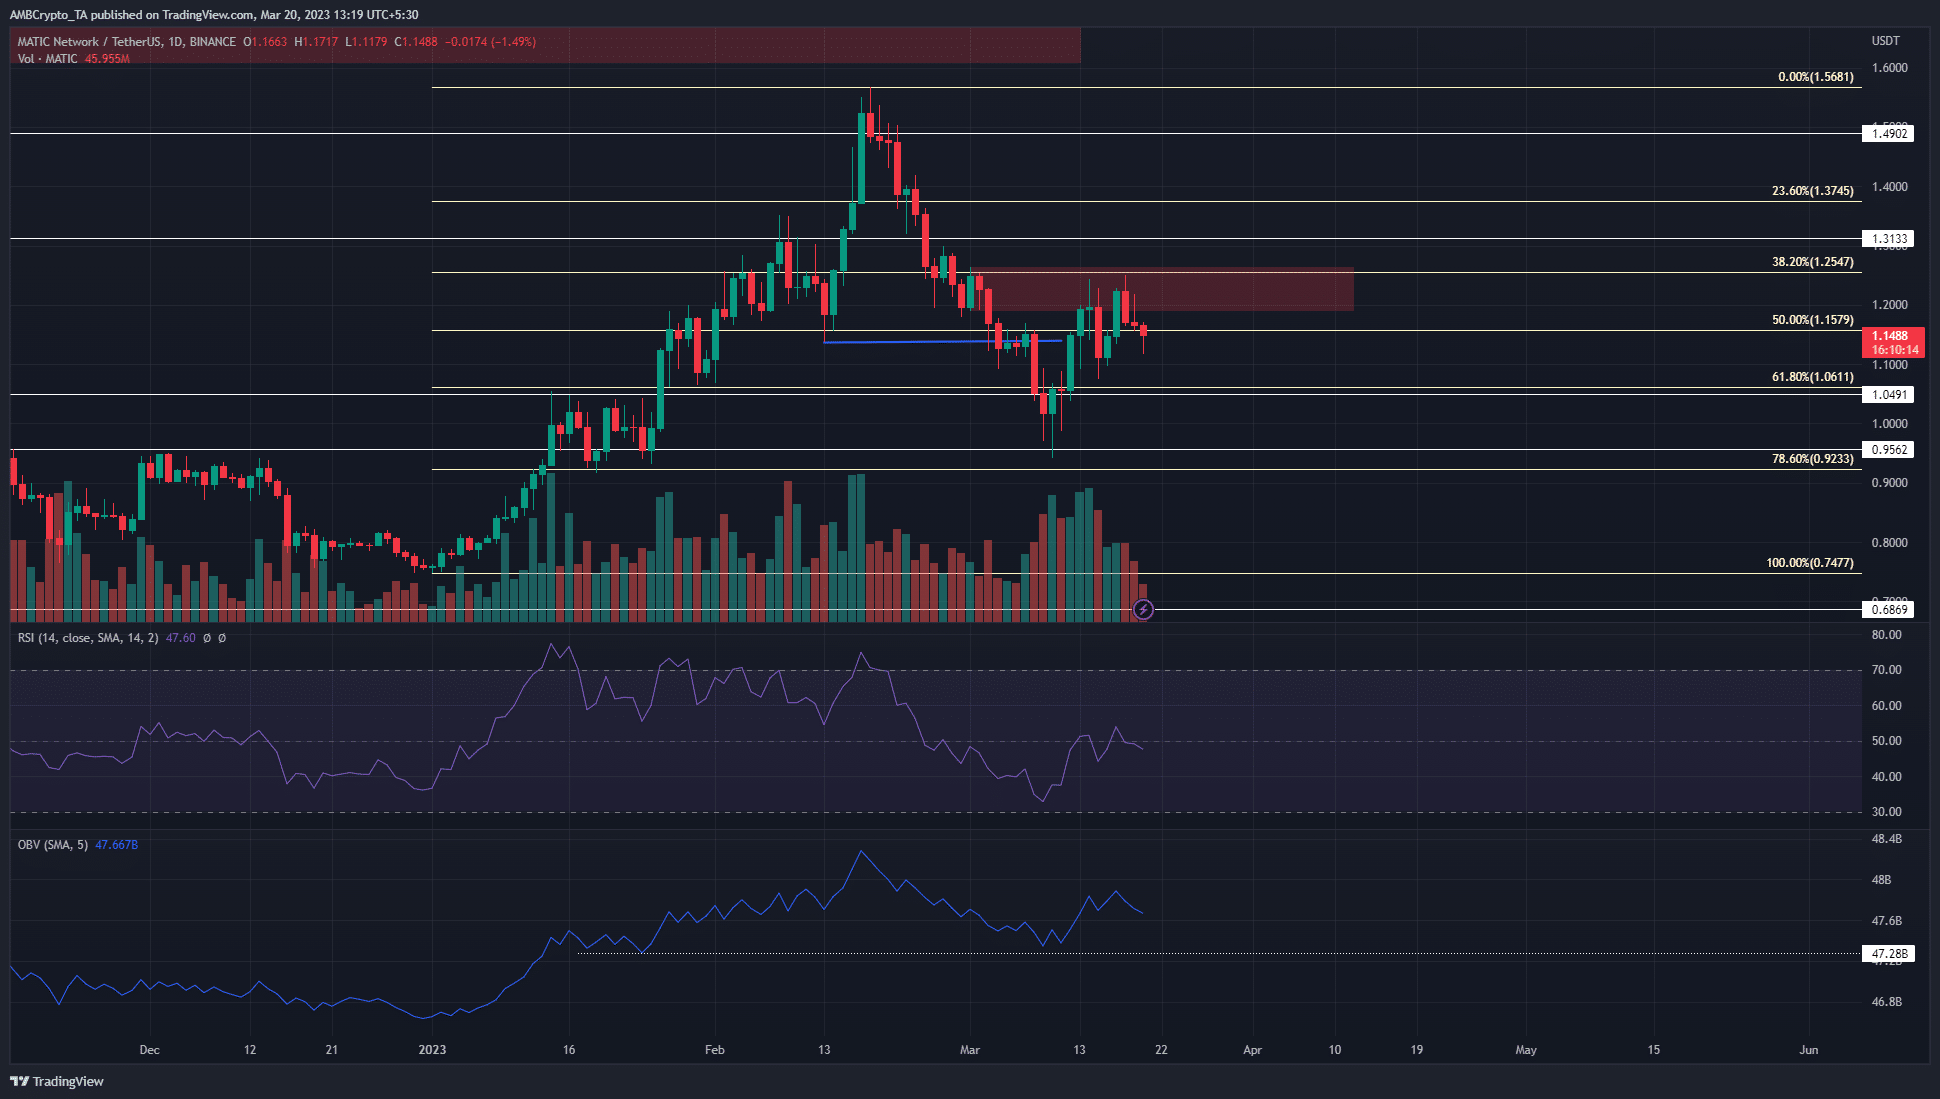
The move upward from $0.74 to $1.56 in January and February saw a large retracement later in February. This continued till 10 March before the prices bounced higher once more. The Fibonacci retracement levels (pale yellow) showed the golden pocket extended from $0.92 to $1.06.
This is a higher timeframe zone of demand, and the buyers have already forced a reaction over the past two weeks from this region. Additionally, the $1 level is a psychological support level as well. The RSI inched toward neutral 50 and indicated that bearish momentum has almost completely waned.
However, as shown in blue on the price chart, MATIC has breached a higher low and thereby flipped its market structure from bullish to bearish on 4 March. The red box highlighted the bearish order block present in the $1.25 area.
Even though the price bounced from the golden pocket, its structure was bearish. Therefore, sellers can look to short the asset in the $1.25-$1.3 area, targeting $0.92-$1 to take profits. Invalidation of this bearish idea would be a daily session close to $1.25.
Realistic or not, here’s MATIC’s market cap in BTC’s terms
The large age consumed spike meant selling pressure could intensify

Source: Santiment
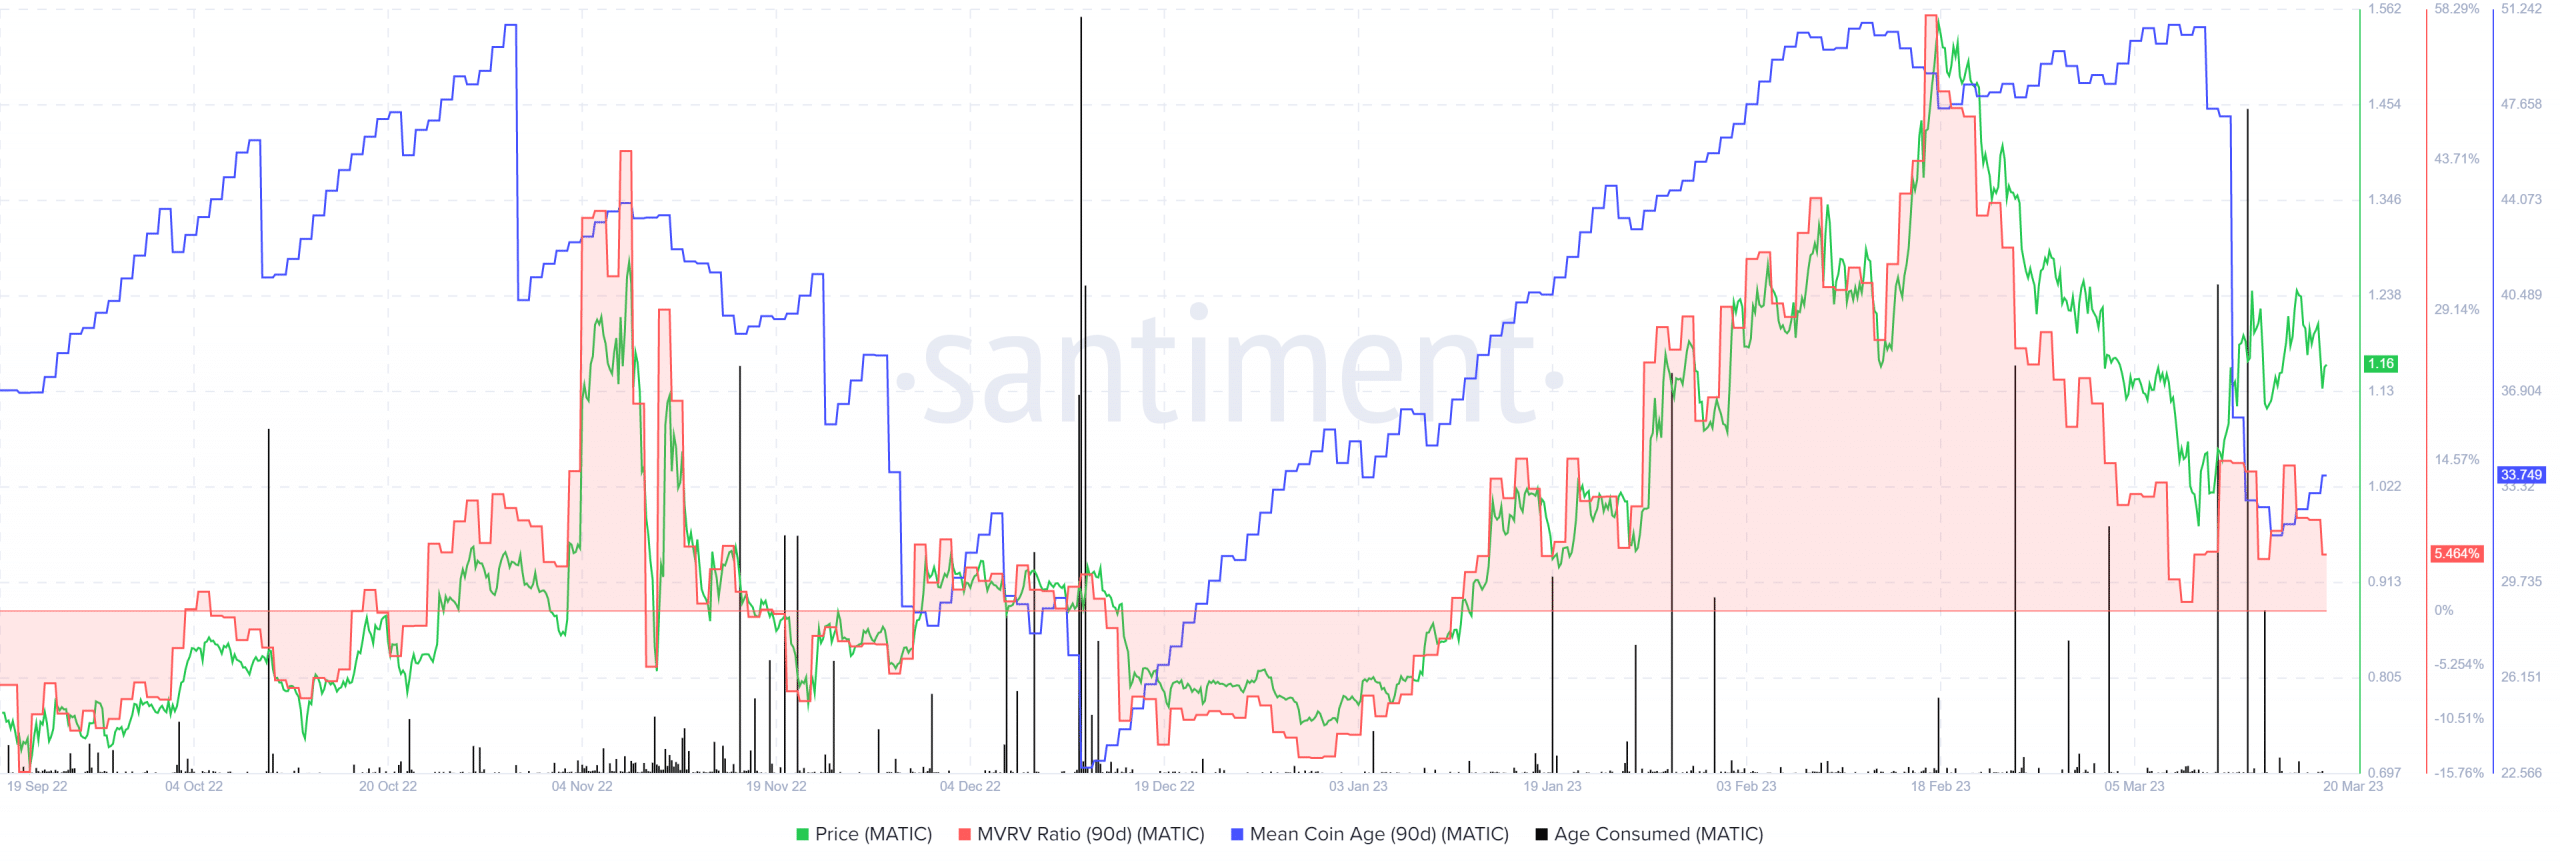
The mean coin age fell off a cliff in mid-March. Soon thereafter, the age consumed metric saw a rapid surge. Both of these metrics indicated a large amount of MATIC was moved between addresses about a week ago. Generally, this would be followed by intense selling pressure. However, that has not occurred.
The mean coin age has recovered very slowly. The 90-day MVRV ratio remained positive, but it has also declined by a large margin over the past month. If the OBV plummeted, MATIC buyers could look to exit the market.


