MATIC forms a bullish reversal candle pattern; should investors HODL or sell

Disclaimer: The findings of the following analysis are the sole opinions of the writer and should not be considered investment advice
The $0.8 and $0.7 areas represent regions where Polygon’s native token MATIC had found good demand in the past. The $0.65 area was visited last July before a 330% rally to reach $2.93 in December.
It was too early to tell whether such an explosive rally could ensue, as the technical structure remained bearish on the charts. Breaking this downtrend could take time, and intense demand would be necessary for the bulls to mount a comeback.
MATIC- 12 Hour Chart
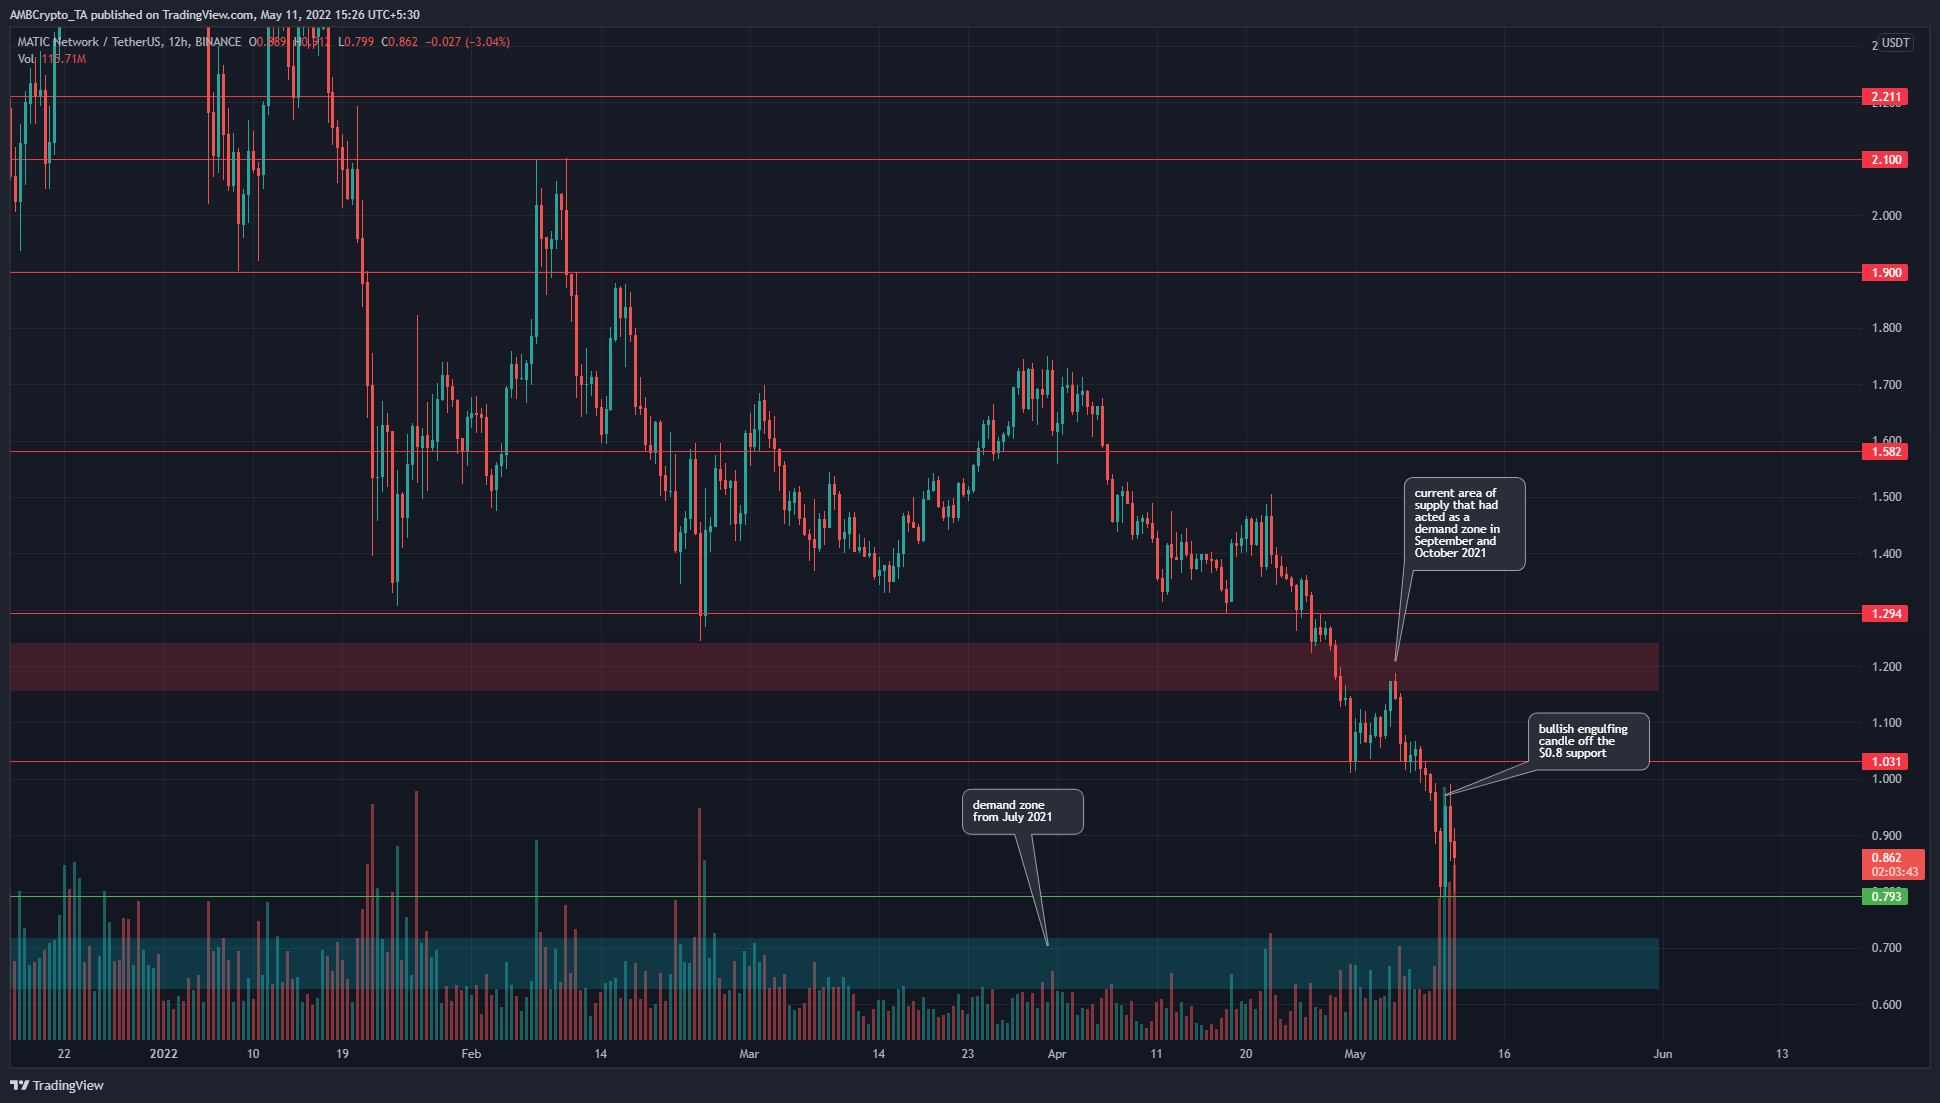
On the charts, we see a steady downtrend for MATIC since December 2021. In mid-March, a rally was witnessed, but the price was quickly pushed back beneath the $1.58 support level.
In May, the price fell below the $1.2 area (red box), which had acted as a zone of demand in September and October. Moreover, MATIC tested this zone to confirm it as an area of supply and fell beneath the $1 level as well.
In the past few sessions, MATIC formed a bullish engulfing candle on its bounce from the $0.79 support level. Such an engulfing indicates strong buying pressure, but the question is- Can bulls really follow through in such bearish conditions?
Further south, beneath the $0.79 level lies the $0.7 demand zone where MATIC had rallied from last July.
Rationale
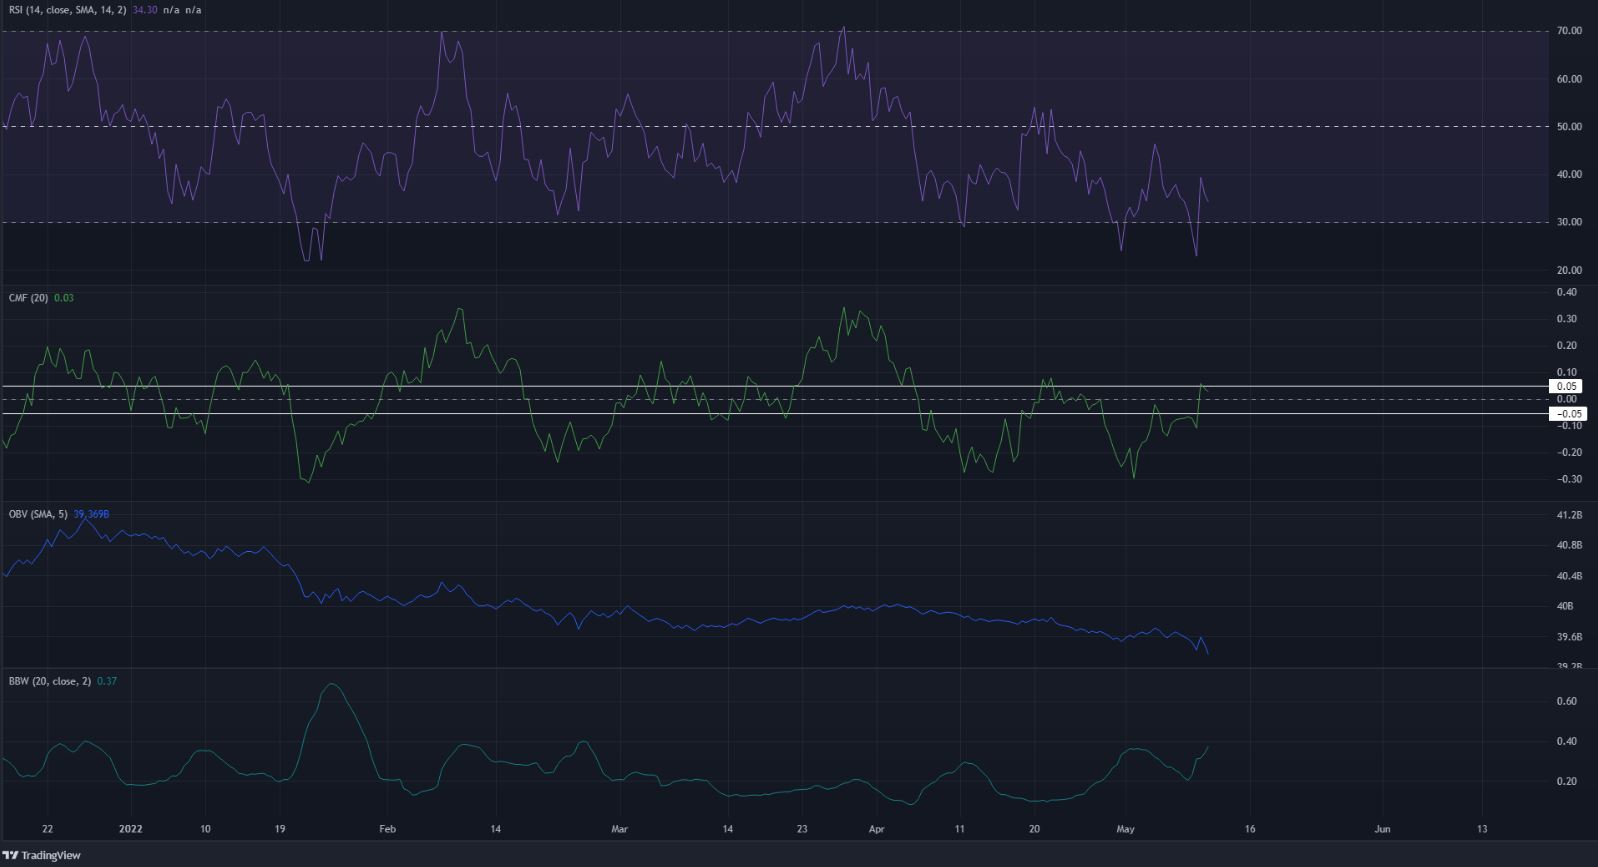
The RSI on the 12-hour chart has been below neutral 50 since late March. This meant that momentum has been on the side of the bears in the past six weeks, and indicated a bearish trend. In the past few days, the RSI continued to be below 50.
At the same time, the OBV has been on a steady downtrend since April began, which meant that selling volume was dominant. This was especially true in the past week, as the OBV plummeted. However, the CMF, which saw a steep decline a few days ago, picked itself up and was back above the zero mark. Hence, there was some suggestion of buying pressure.
The Bollinger bands width indicator has formed a series of higher lows in the past week, showing that volatility has been on the rise in this time period.
Conclusion
The indicators and the trend pointed toward a continuation of the bearish trend. Volatility was on the rise, and selling pressure remained strong. Imminent levels of significance are the $0.8 support and $1 resistance, and a move past either level would likely dictate the direction of MATIC in the days or weeks to come.