MATIC has shed 50% from May highs, could more losses be in sight

Disclaimer: The findings of the following analysis are the sole opinions of the writer and should not be considered investment advice.
Altcoins that fall by 50% on the charts can fall yet another 50%. Polygon has been on a steady downtrend on the charts since late March and flipped the $1.2 region from demand to a supply zone in May. The number of unique addresses on the MATIC chain has dropped by an astonishing 85%. Whale transactions were also falling.
This showed a network in decline which was reflected on the price charts as well.
MATIC- 12 Hour Chart
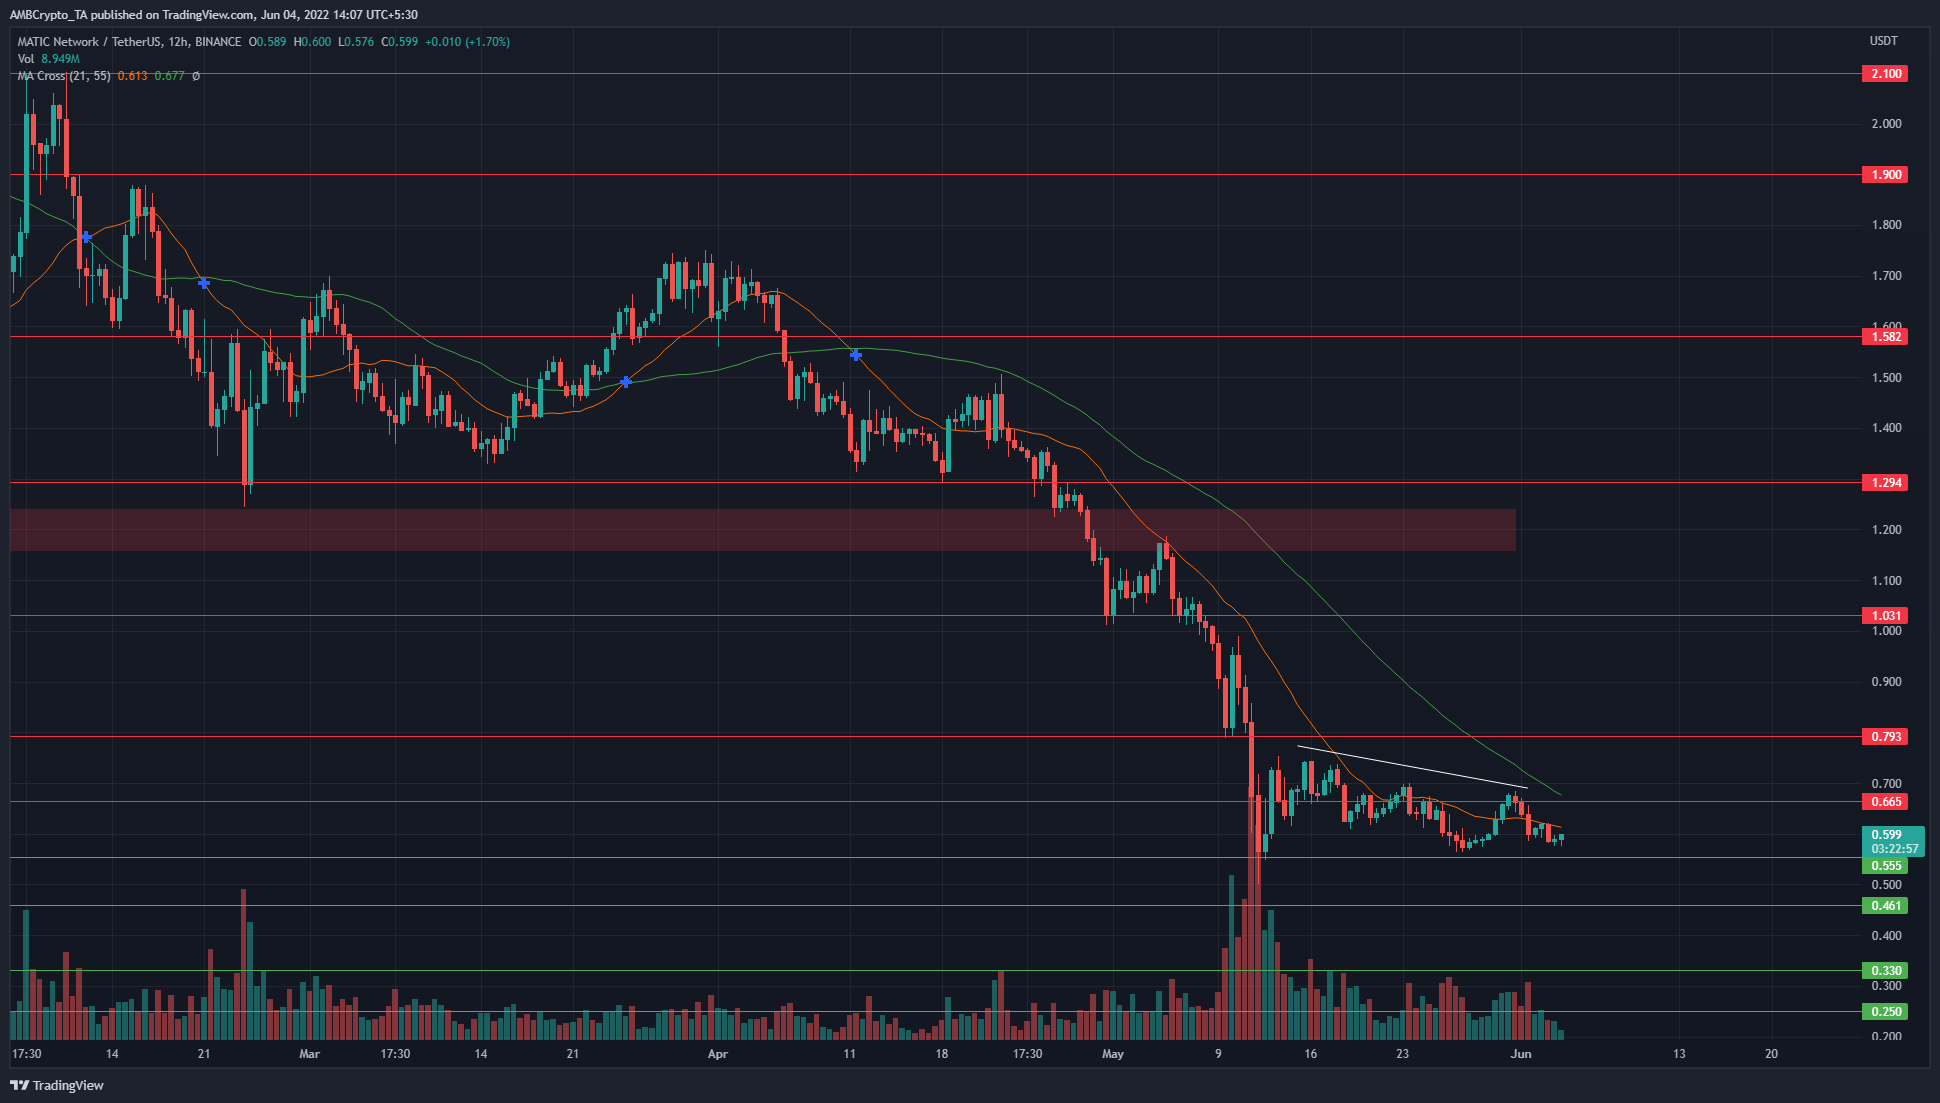
The downtrend was characterized by a series of lower highs and lower lows on the H12 chart from late March. The mid-March rally saw MATIC climb from the $1.36 lows to the $1.71 highs. At the time, it did break just above a previous lower high, and for a few days, it appeared to signal a bullish market in the making. However, the bulls were unable to defend the $1.58 support level and crashed right through this level early in the month of April.
It was a similar tale in May when the price dropped below the $1.2 demand zone and retested it as resistance. The $1 level did not last long as support either.
The bears are extremely strong on the charts, and even though there are lower timeframe rallies, the downtrend appeared set to continue. The 55-period moving average (green) and the 21-period SMA have both acted as resistance in the past two months. The price would need to rise past the 55 SMA, and also the $0.75 level in order the break the previous lower high.
Rationale
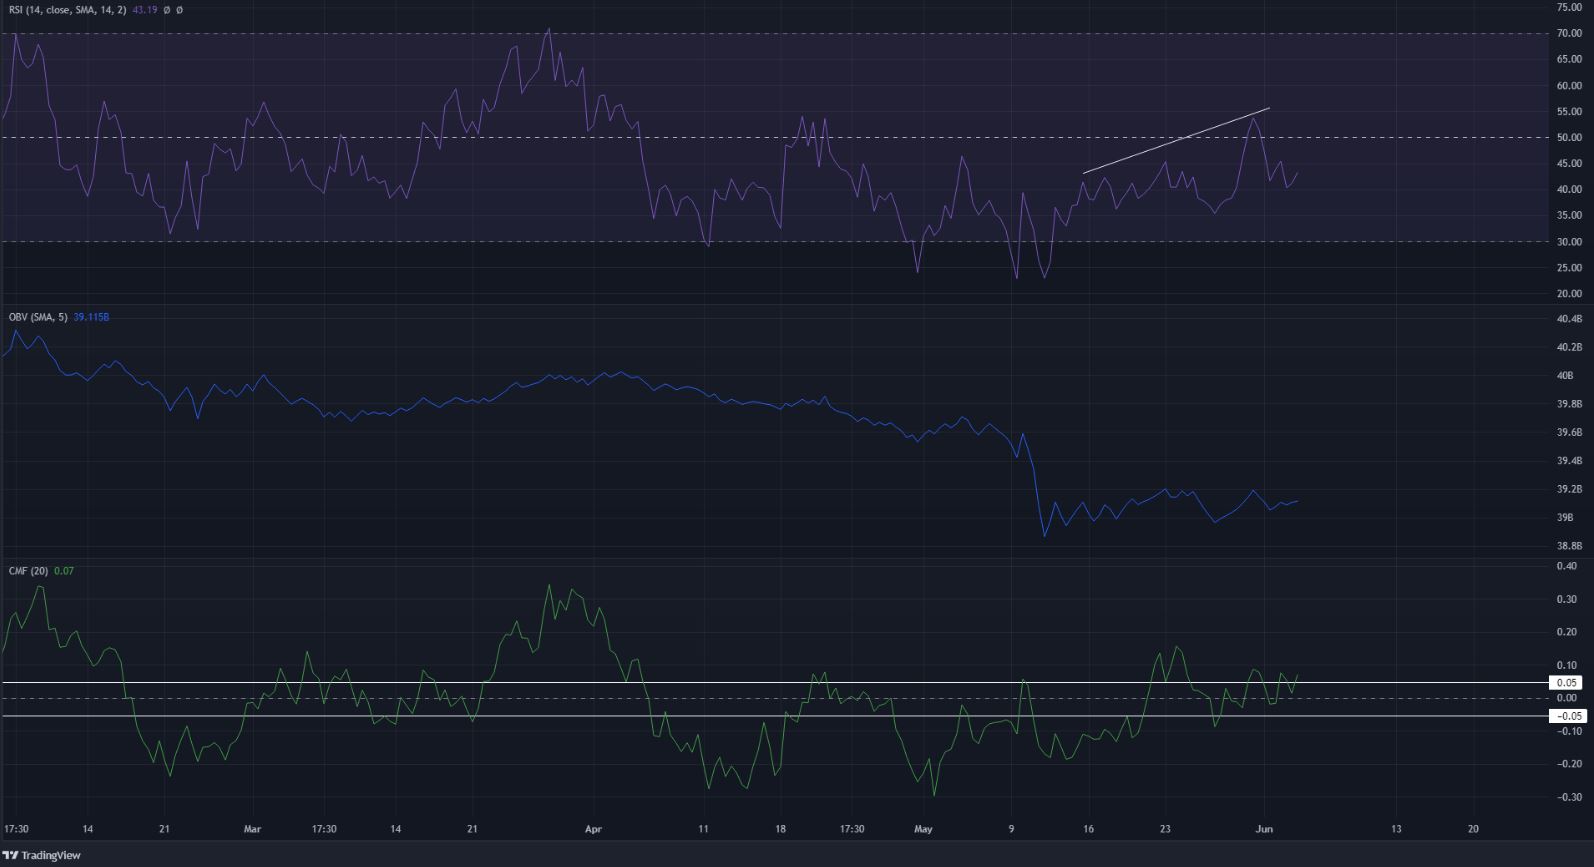
Highlighted in white on the RSI is a series of higher highs, while the price made a series of lower highs on the price chart. This is a hidden bearish divergence in the making and is indicative of a continuation of the downtrend.
At press time, the RSI was beneath neutral 50, and highlighted bearish momentum remained dominant. The OBV has also seen a sharp drop in May, and even though it has made higher lows in the past couple of weeks, there was no evidence yet of strong demand to reverse the downtrend.
The CMF was just above the +0.05 level to indicate some notable capital flow into the market.
Conclusion
The trend remained bearish, and the indicators did not show a trend reversal in sight yet. The hidden bearish divergence suggested that the prior downtrend was likely to continue in the days/weeks to come.