MATIC: How traders stand to gain from this pattern’s breakout

Disclaimer: The findings of the following analysis are the sole opinions of the writer and should not be taken as investment advice
There seems to be some kind of disparity between MATIC and other altcoins at the moment. Its daily gains of 0.96%, 3.48%, and 1.48% between 29-31 July were moderate, when compared to some of its other counterparts. In fact, many of the latter registered a spike in value on the back of Bitcoin’s latest rally.
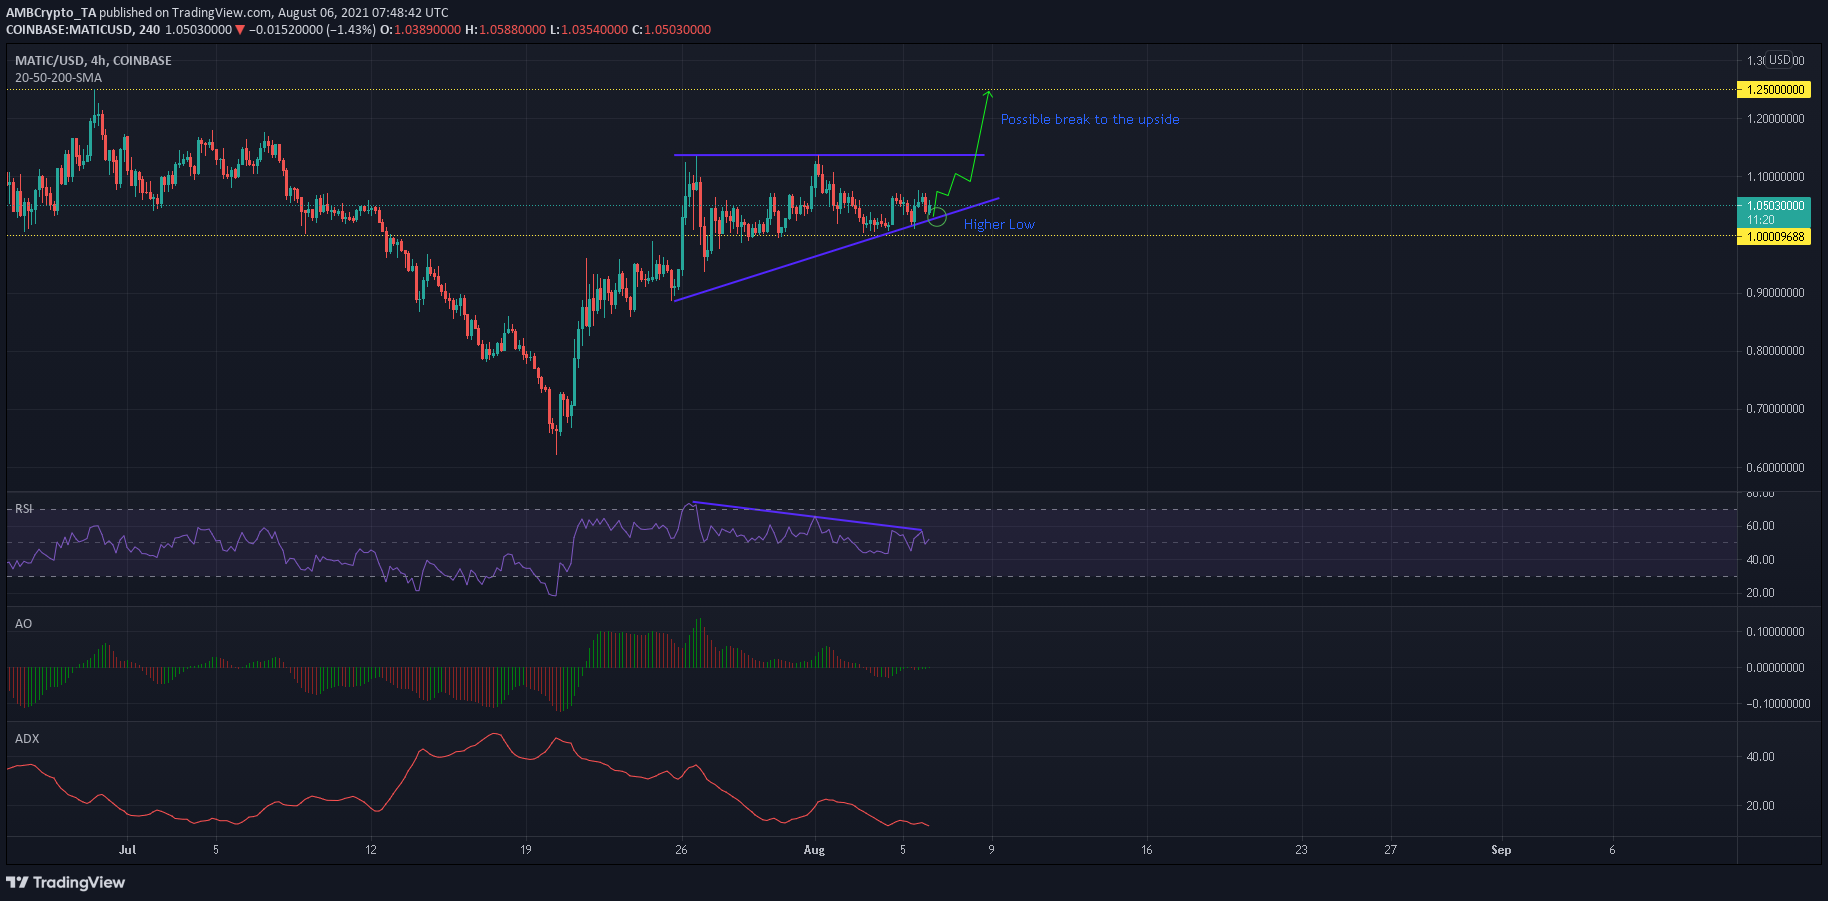
However, MATIC did move within an ascending triangle, something that presented chances of an incoming rally. At the time of writing, MATIC was being traded at $1.05 and held the 18th position on CoinMarketCap’s crypto-rankings.
MATIC 4-hour Chart
Here, it is important to talk about MATIC’s staggering rise immediately proceeding the crypto-crash on 19 May. Its gains of 110% in late May propelled it into the top-15 after the crash triggered reactionary buying in the broader market. Since making the move, the altcoin has fallen below multiple support areas due to profit-taking at various levels.
An upper sloping trendline charted out (not shown) its severe decline in value. A break above this line on 21 July came as a relief as the downtrend was finally overturned by the bulls.
Ascending Triangle
Despite MATIC not keeping up with some other alts in the market of late, its price has had some developments of its own. Two peaks were formed at $1.135, followed by higher lows. An ascending triangle formed in the process – A setup that usually sees a break to the upside. If the price breaks above the upper trendline, a 10% gain would be in the offing. This could push the alt to $1.25.
However, the crypto’s indicators suggested that a favorable outcome cannot be anticipated in the near term.
Reasoning
The Relative Strength Index formed three lower peaks – A sign of some weakening in the market. Momentum was also muted, something pointed out by the Awesome Oscillator.
Moreover, the ADX clocked in at 12 and indicated that neither the bulls nor the bears were in control of the price. While these were not exactly the makings of an upcoming rally, a buy opportunity seemed to be on the cards.
Conclusion
MATIC is likely to resume its rangebound movement over the coming sessions and a slight dip might also be possible. This would allow traders to long MATIC at a higher low of $1.03 to take advantage of a possible ascending triangle breakout.