MATIC sees a weak bounce inside a demand zone, what can it mean for traders

Disclaimer: The findings of the following analysis are the sole opinions of the writer and should not be considered investment advice
Data from Coinglass showed that, in the past few days, the percentage of short positions has been slightly greater than that of long positions. The long/short ratio has been climbing in the past week to suggest that market participants were looking to long MATIC. The short positions were greatest when the price was near the range highs at $1.75. Can this mean that the native token of Polygon can see a bounce?
MATIC- 1 Hour Chart
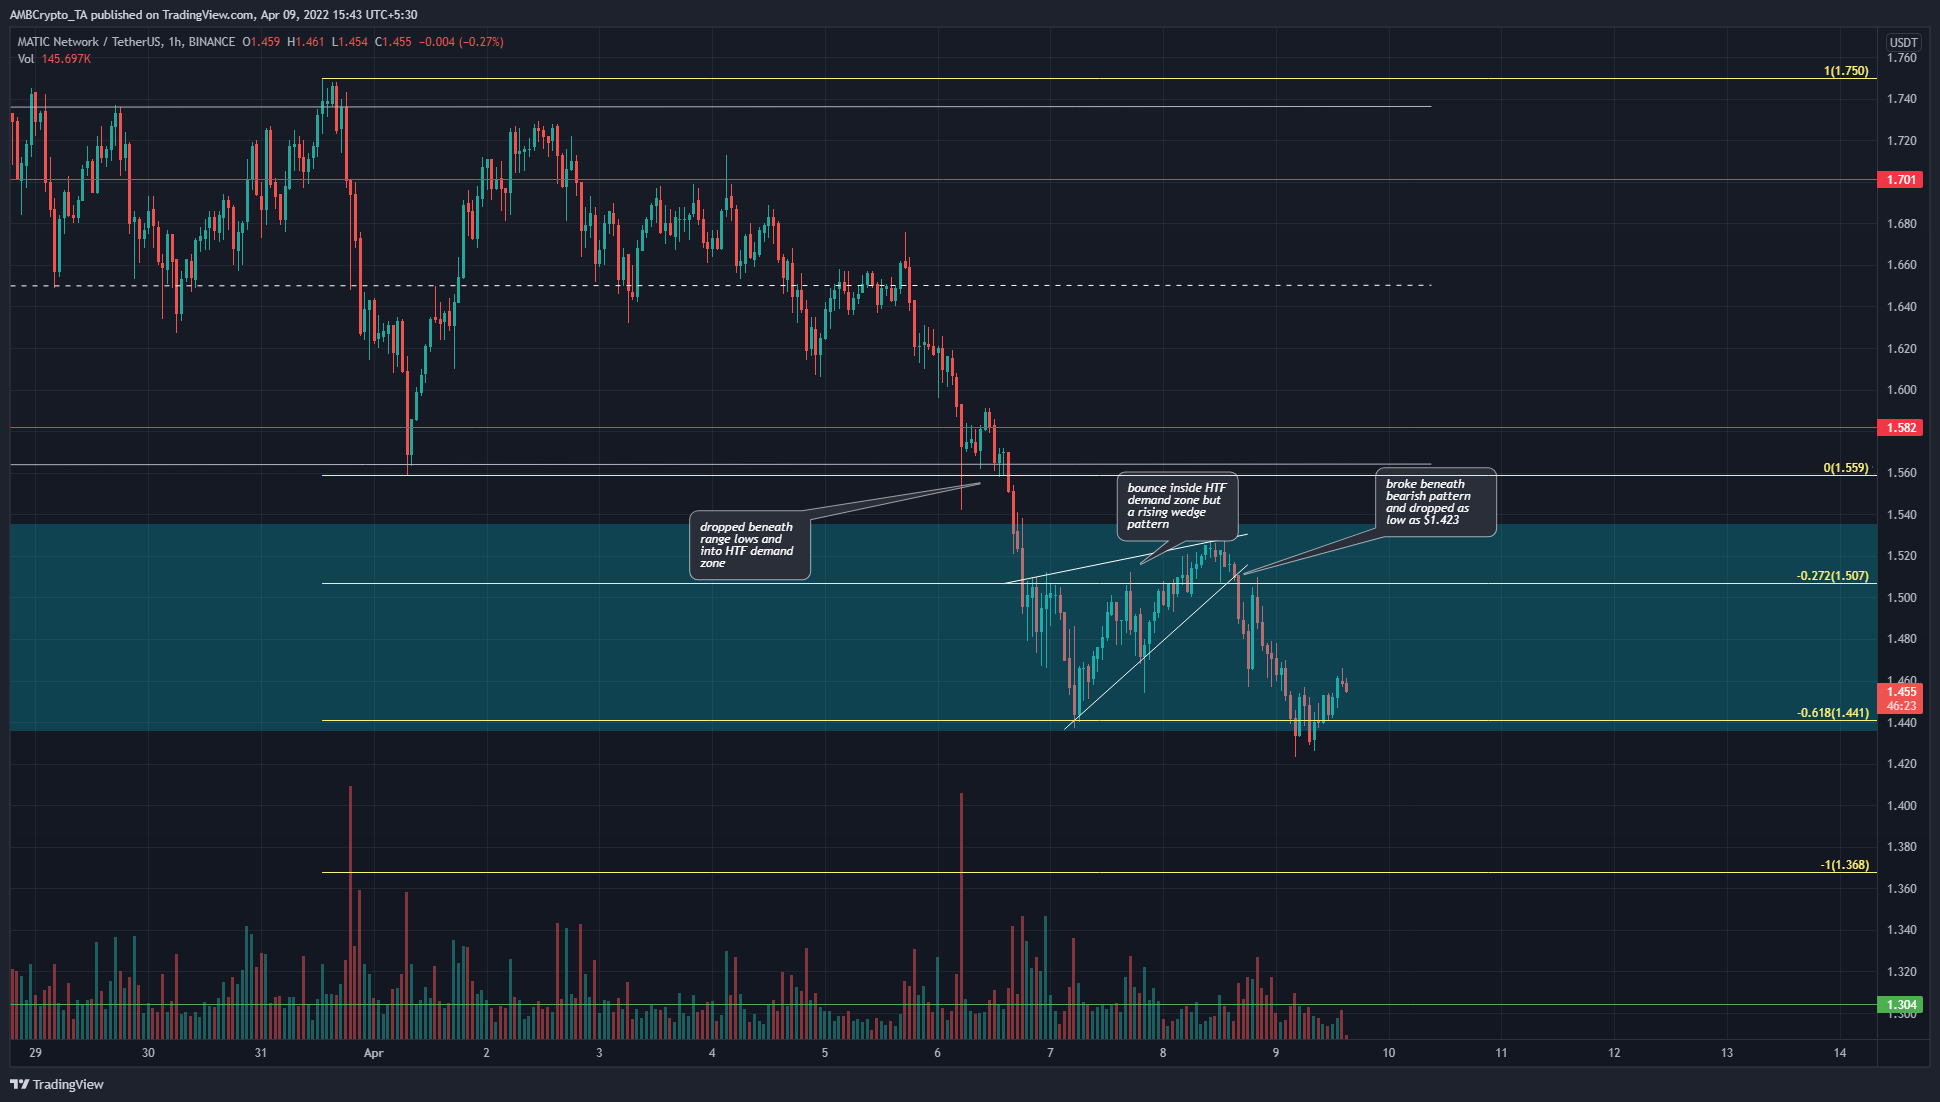
Not quite. On the 12-hour timeframe, the $1.42-$1.5 area was identified as a bullish order block. Therefore, the cyan box on the chart above is a place where buyers would be looking to buy a retracement. Yet, that has not yet panned out.
Rather the opposite- as the price attempted to bounce from $1.44, it formed a rising wedge pattern and registered a lower low as well. This development hinted that further lows are likely to be seen.
The Fibonacci extension levels (yellow) based on the price’s move down from $1.75 to $1.559 showed the 61.8% and 100% extensions levels to lie at $1.44 and $1.368. Since the market structure was already bearish and MATIC has dipped below $1.44, it was likely that it would be headed toward $1.36 and $1.3 next in search of demand.
Rationale
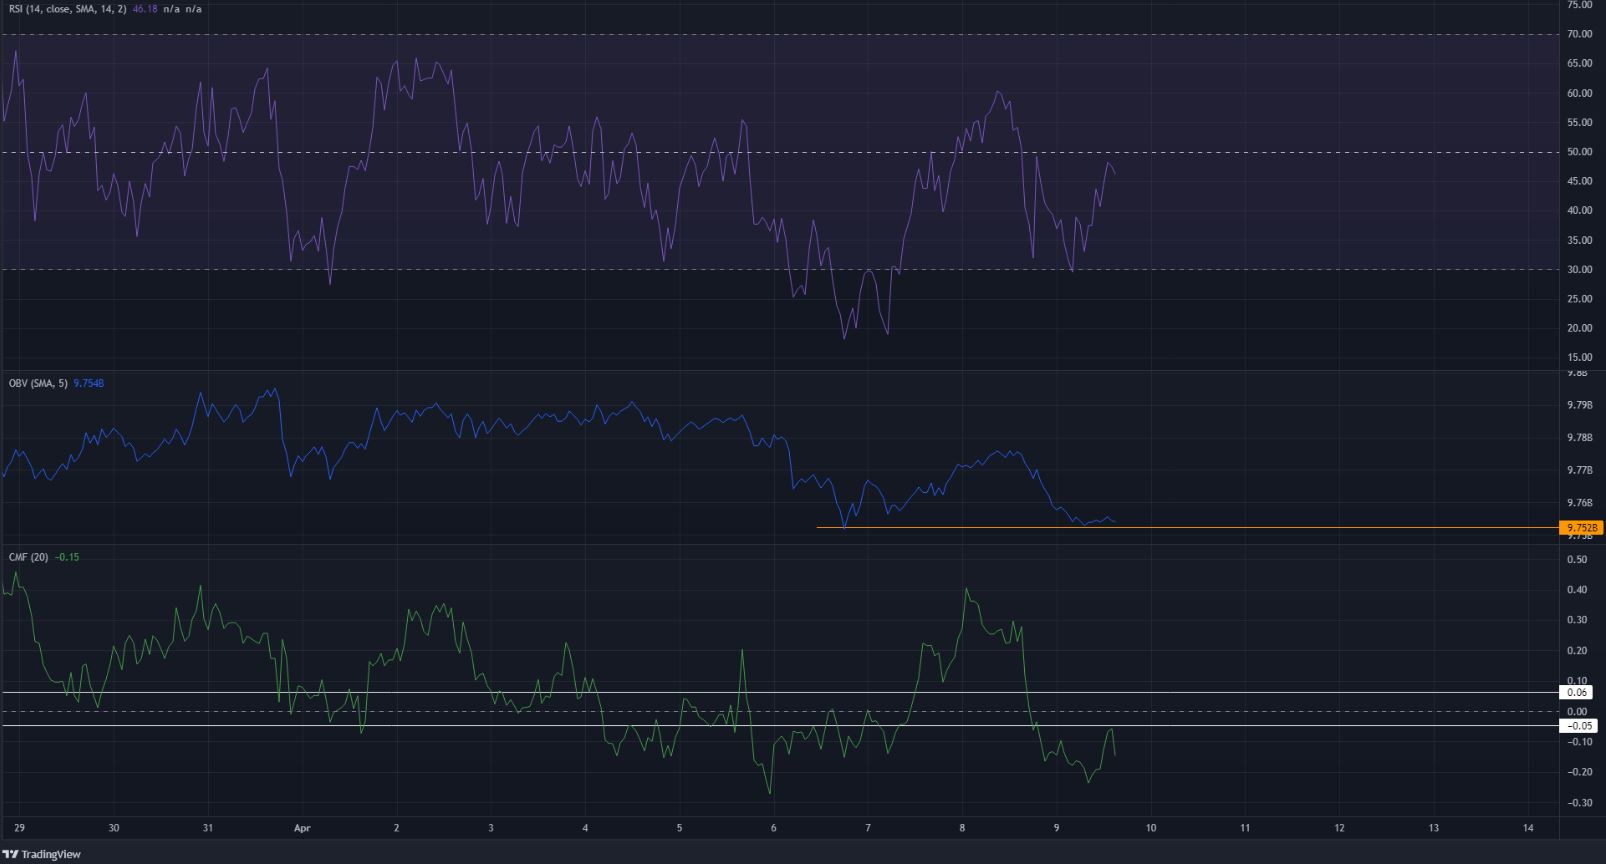
The RSI on the hourly chart neared neutral 50, and if it moves beneath 40 once again in the next few hours, it would be a sign of bearish strength. The OBV was at a level it had previously visited a couple of days ago on the bounce from $1.44. Hence, if the OBV descends below the orange line, it would be another sign of rising selling pressure.
The CMF also continued to stay beneath the -0.05 mark to denote significant capital flow out of the market.
Conclusion
On the lower timeframes, the market structure and momentum remained bearish for MATIC. The price had been unable to bounce strongly from the higher timeframe bullish order block (cyan box). A session close below $1.44 would likely see MATIC head toward $1.36.