MATIC’s close above this range can provoke rally toward $1.18

Polygon’s [MATIC] recent bull run evoked a break beyond the EMA ribbons to reveal a robust buying revival. As the ribbons finally undertook a bullish flip, the $1-zone has been plateauing the streak of green candles.
The breach of its up-channel has signified ease in the buying pressure. A reliable jump below the existing pattern could expose the coin to a near-term downside in the coming sessions. At press time, MATIC was trading at $0.9215.
MATIC Daily Chart
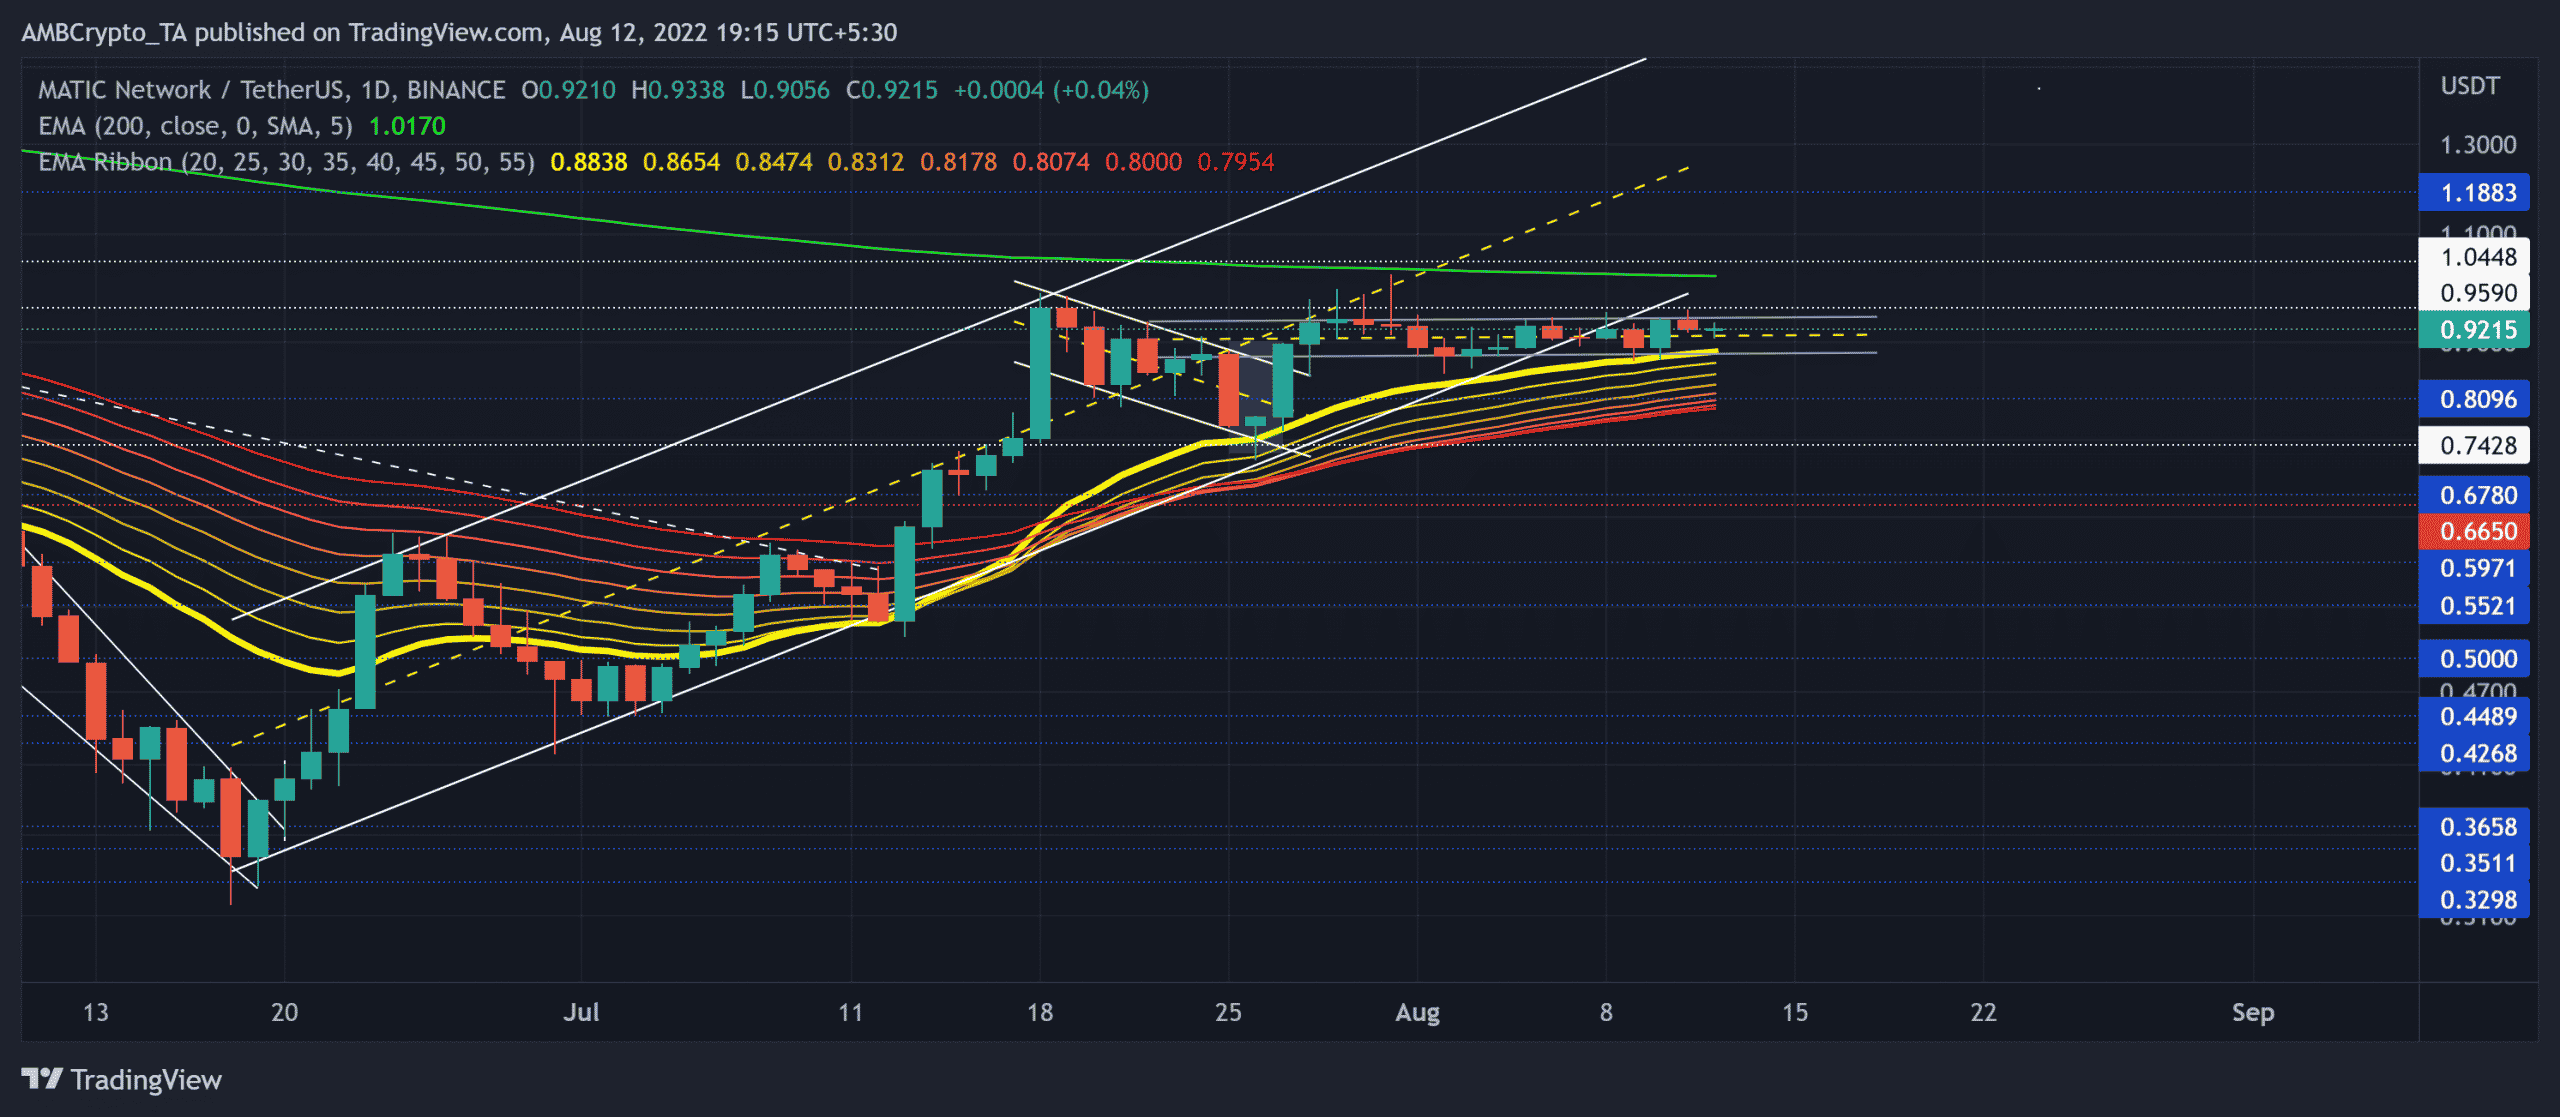
The recent ascending channel (white) oscillation aided MATIC bulls to steer the trend to their fancy while flipping the 20 EMA from resistance to support.
However, the 200 EMA kept looking south while coinciding with the $1-zone resistance. This conflux of resistances created a stiff near-term hurdle for the bulls.
Going forward, the alt could continue its compression in the $0.88-$1 range while committing itself to a side channel in the daily timeframe. Any drop below the sideways track or the 20 EMA could expose the alt to a short-term plunge toward the $0.809 level.
An eventual close above the $0.95-$1.04 range can provoke a rally toward the $1.18 zone. But the bulls were yet to ramp up the trading volumes to sustain a close above the immediate resistance range.
Rationale
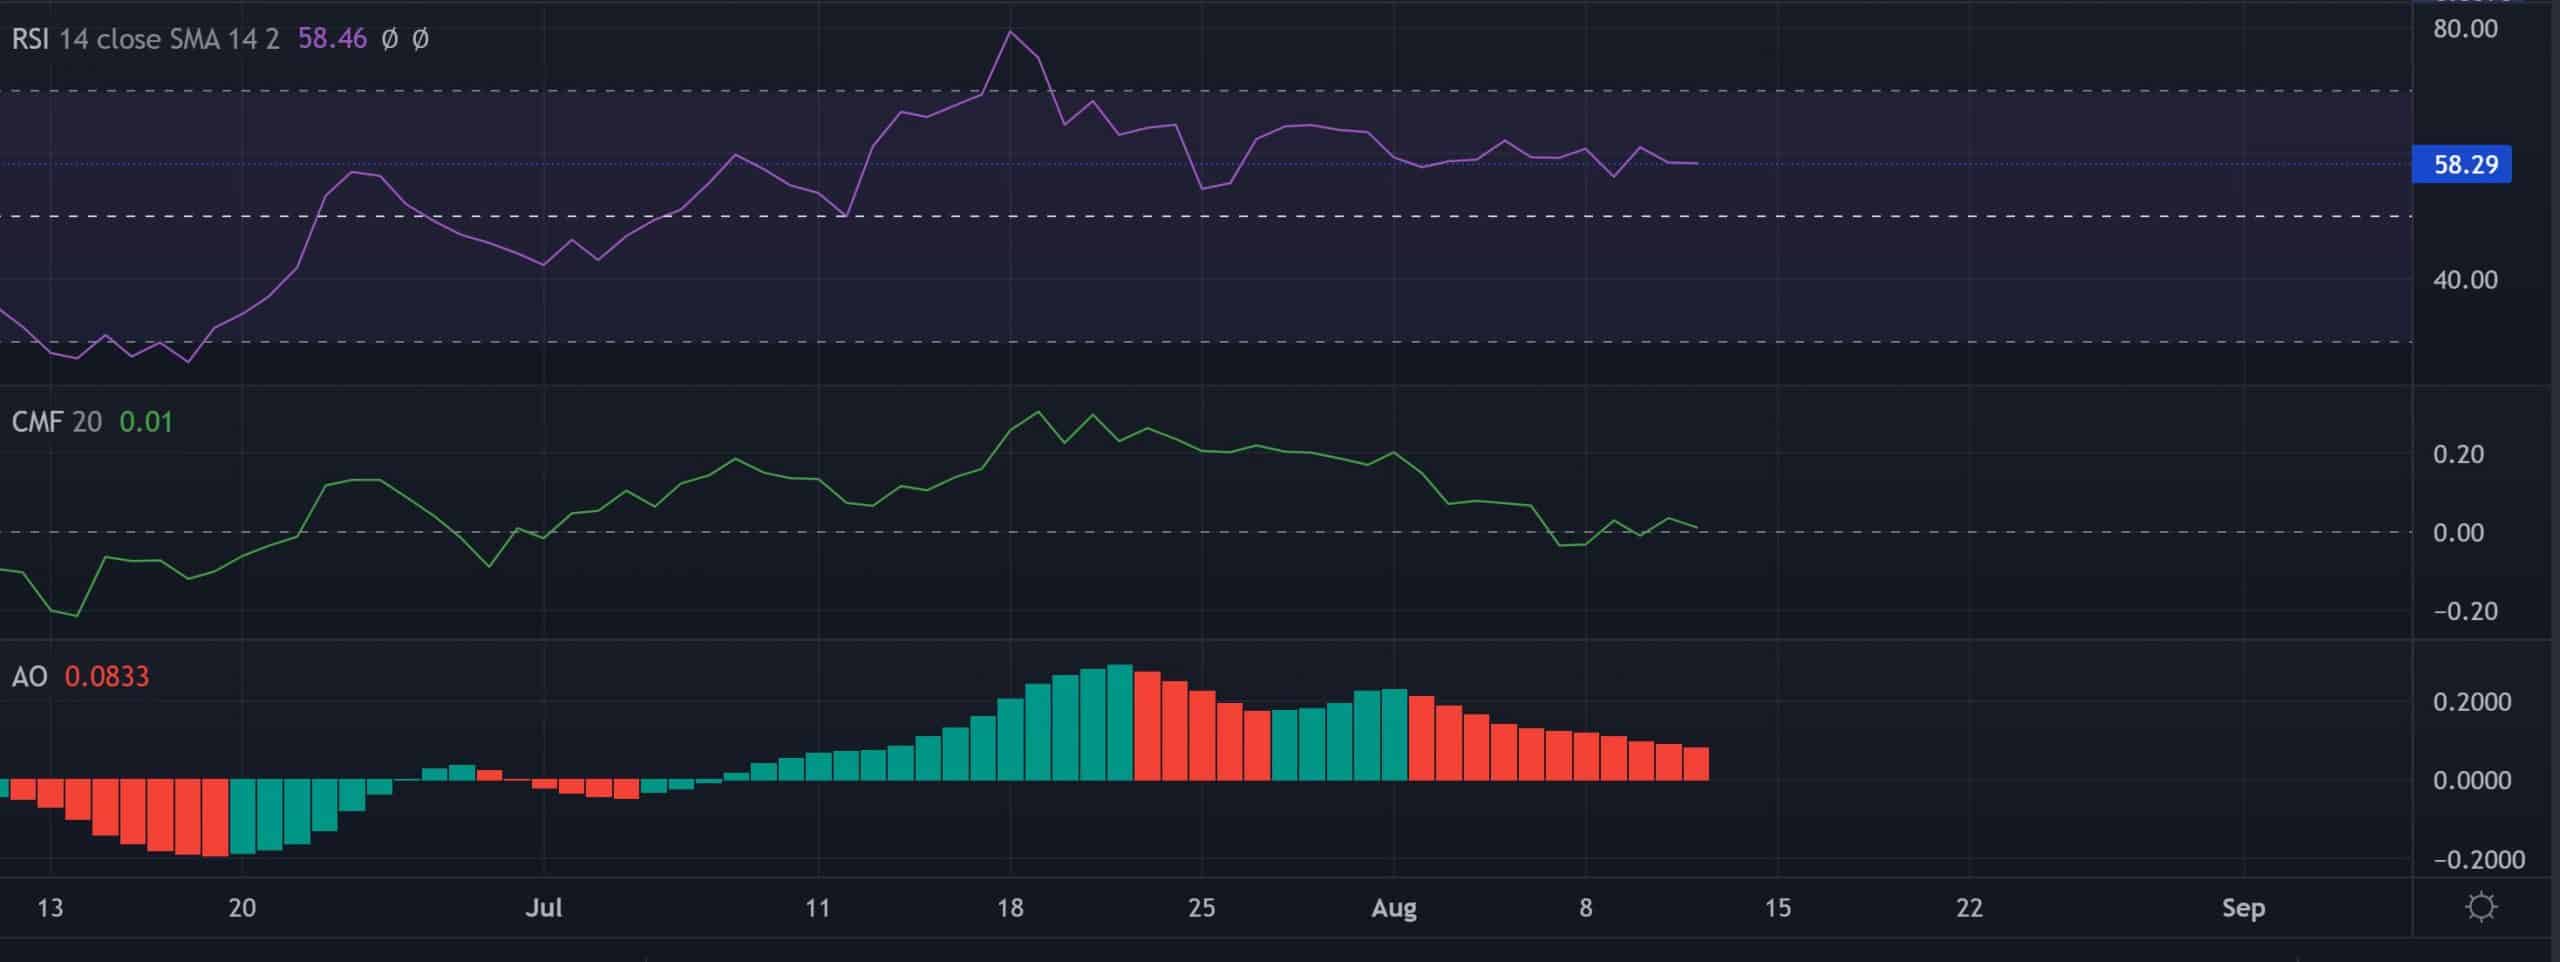
The Relative Strength Index (RSI) ensured its position above the midline to depict a slight buying edge. A fall below the 58-mark support could reaffirm the decline tendencies on the chart.
Furthermore, the Chaikin Money Flow’s (CMF) lower peaks highlighted ease in buying pressure. Traders/investors should look for a close below the zero-mark to confirm their bearish bias.
The Awesome Oscillator (AO) was on a gradual downtrend as it approached its equilibrium. A potential uptick in the volumes could help the alt break away from its low volatility phase.
Conclusion
MATIC’s sway above the EMA ribbons reflected a broader bullish advantage. Should the breakdown from the up-channel reignite short-term selling tendencies, the targets would remain the same as discussed. A consequent close above the 200 EMA would confirm a bearish invalidation.
Finally, investors/traders must keep a close eye on Bitcoin’s movement as MATIC shares a 94% 30-day correlation with the king coin.