Monero halted after trending upward the past month, where to next?

Disclaimer: The information presented does not constitute financial, investment, trading, or other types of advice and is solely the writer’s opinion
- The Volume Profile tool highlighted heavy resistance at $147.
- The technical indicators showed bulls have some hope, so long as a critical level of support was defended.
Monero faced stern resistance in the $150-$160 region since mid-September. The surge to $160 in early November was quickly reversed after the FTX implosion played out on the price charts. At press time, Monero bulls showed they still had some fight left in them.
Read Monero’s Price Prediction 2023-24
Bitcoin continued to defend the $16.2k-$16.6k area over the festive season. The area as far south as $15.8k was something BTC bulls must guard in order to keep alive their hopes of a move up to $18k.
The $134-$139 region has been defended so far and the psychological $150 is a target
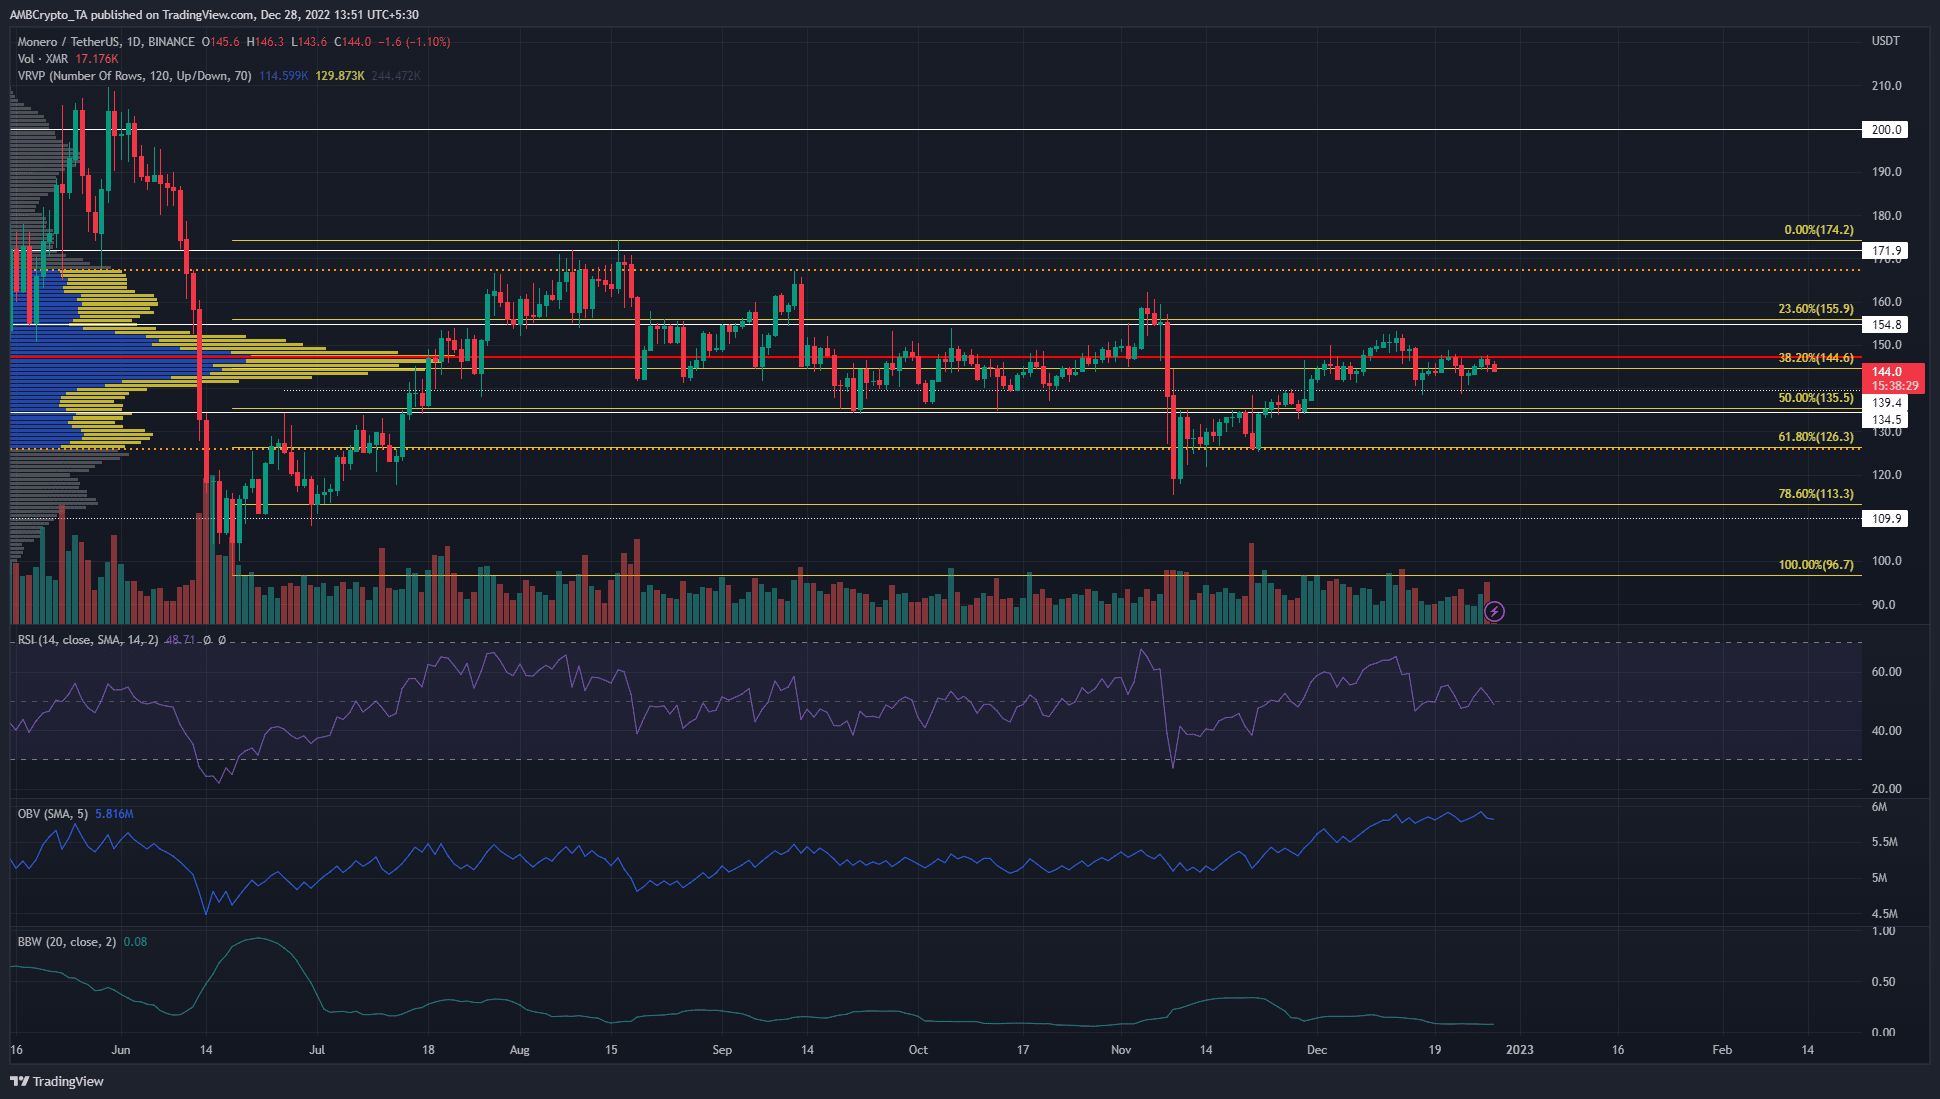
The Volume Profile Visible Range tool plotted the Point of Control to lie at $147. The Value Area High and Low lay at $167 and $126 respectively. The entire region from $144-$148 was a high-volume node as per the VPVR.
Hence, this area was likely to pose heavy resistance to the price. A daily session close below the $139.4 level would indicate a shift in favor of the sellers. Even so, the $135 level can serve as support yet again and repel the bears.
A safe entry for buyers could be the $134-$140 region, targeting the Value Area High at $167 to take profit at. The local top from November at $160 can also be used to take a profit.
The RSI stayed above neutral 50 despite the pullback from $151 over the past two weeks. The OBV was even more encouraging and formed a series of higher lows since November. This outlined the presence of steady demand behind the asset.
Are your XMR holdings flashing green? Check the Profit Calculator
The Bollinger bands width indicator was in decline, and its expansion will signal a strong move was in the making. Based on the OBV, this move could see XMR climb higher.
Sentiment in futures market remains bearish for Monero
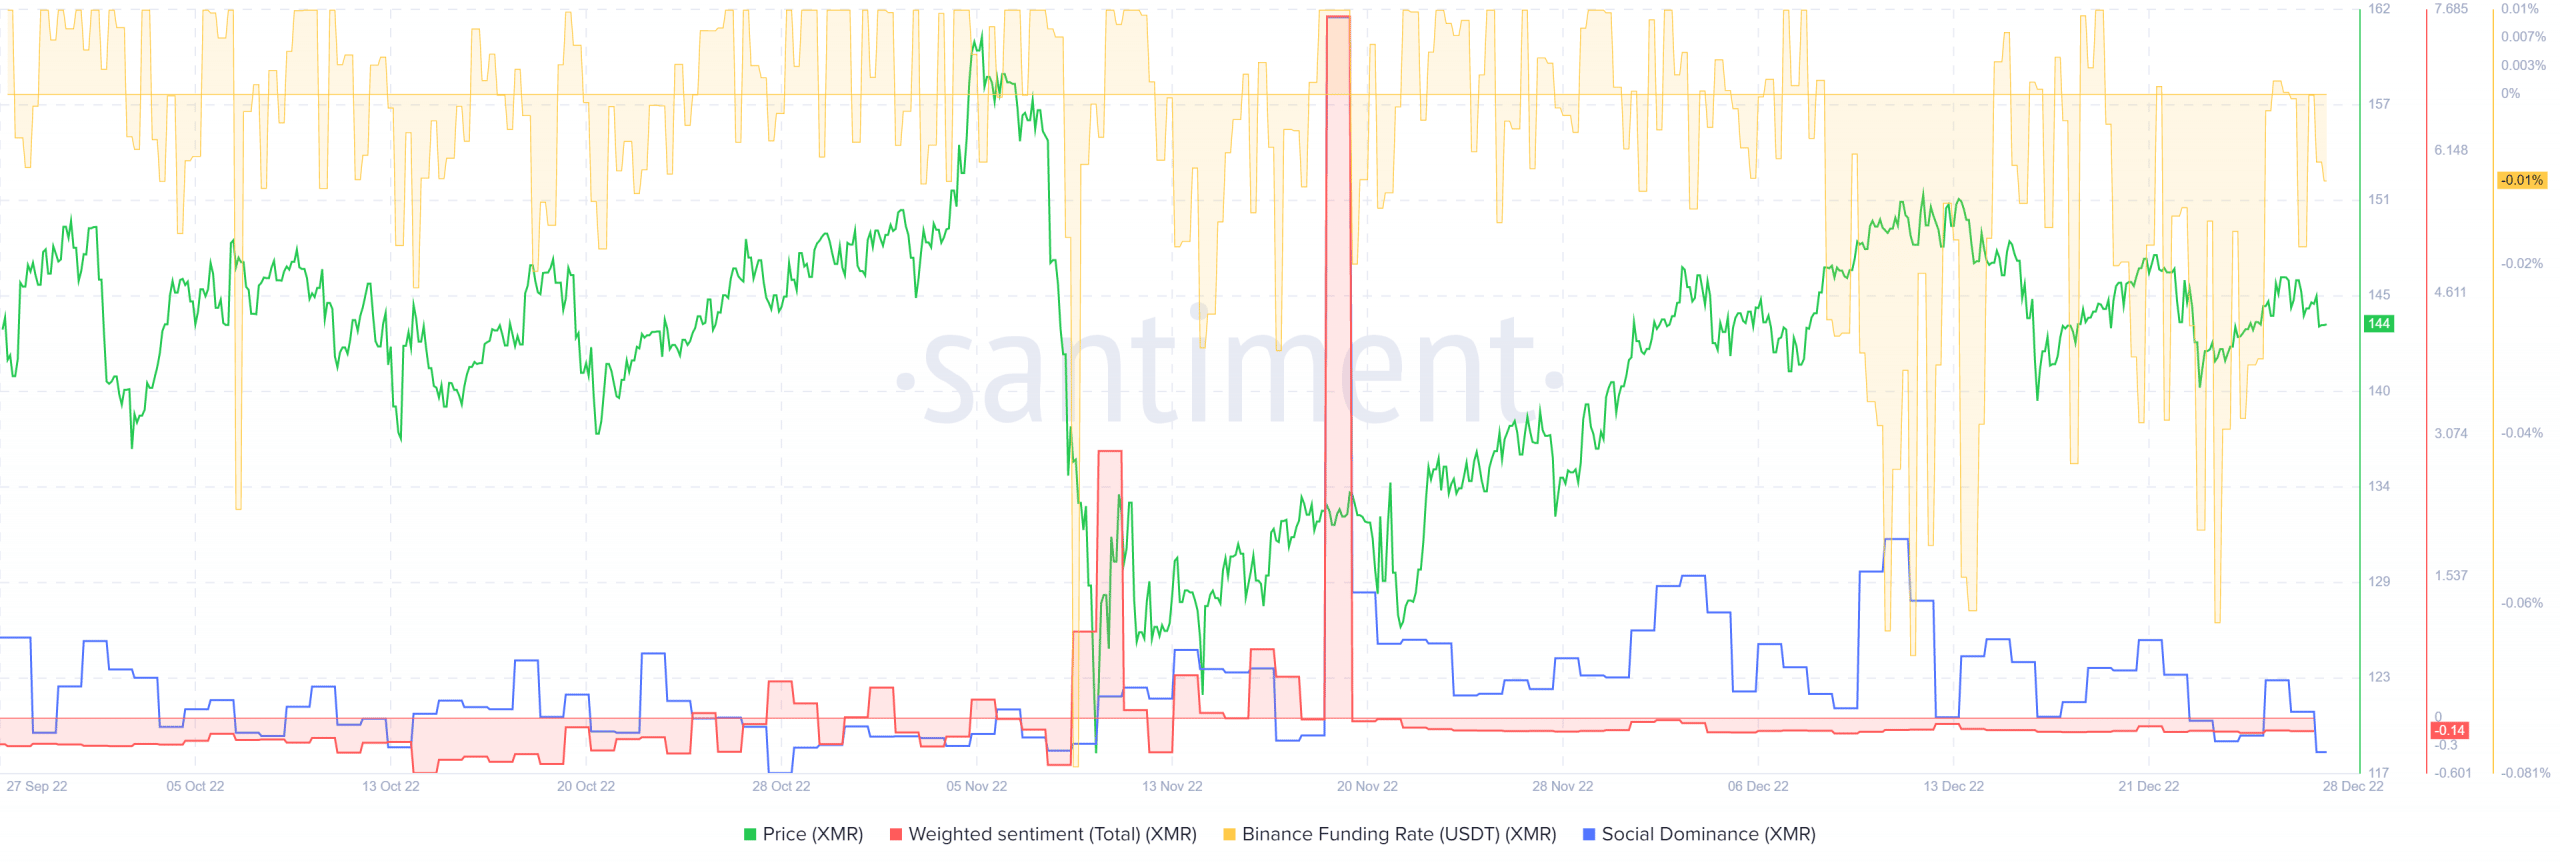
The funding rate has been negative for the better part of December, even when the price was trending upward on lower timeframes in the days leading up to 13 December. Since that day, XMR has formed a series of lower highs on the price charts.
The weighted sentiment was negative since the mid-November surge. Alongside the price, social dominance has also been in a downtrend.
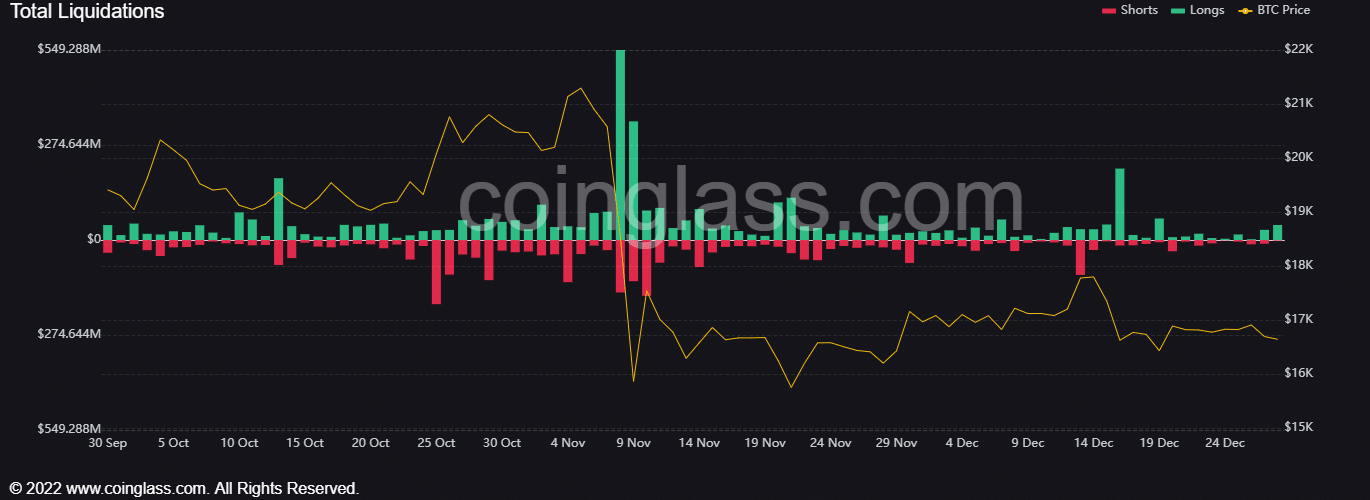
The liquidation chart showed a large number of long positions wiped out during the crash that commenced on 16 December, amounting to $206.5 million. At that time, the Open Interest also declined significantly in response to the liquidations.
Over the past ten days, the OI slowly climbed higher. However, the price did not establish a trend but rather bounced between the $140 and $147 levels. This, alongside the rising OBV, hinted that a move upward was possible for Monero if Bitcoin does not fall beneath the $16.2k-$15.8k area.