
Monero, DigiByte, and OMG Network told pretty similar stories on the price charts. The bulls did not show they had the strength yet to effect a climb past their imminent levels of resistance.
Monero [XMR]
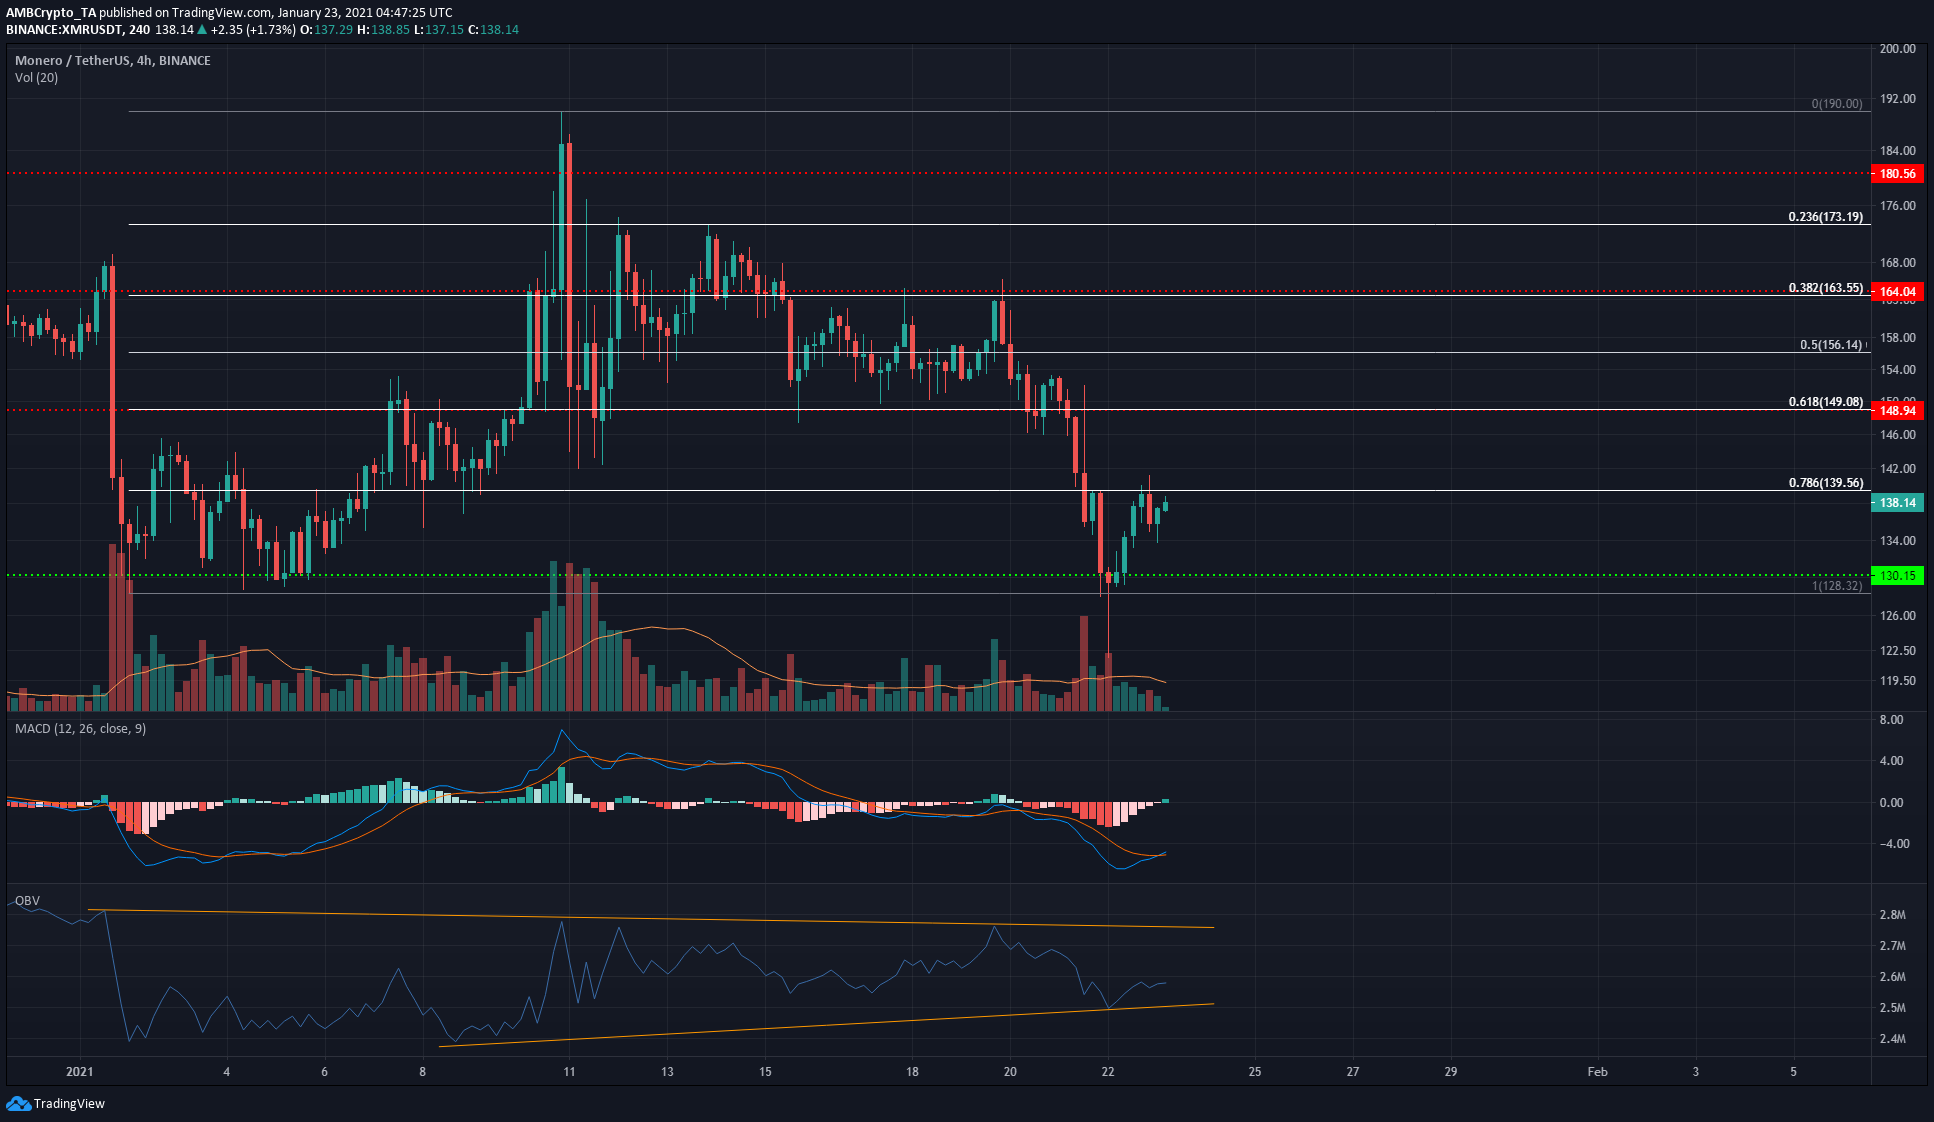
Source: XMR/USDT on TradingView
The Fibonacci Retracement levels for XMR’s move north from $128 to $190 gave some important levels of support and resistance for the price. At the time of writing, XMR faced resistance from the 78.6% retracement level at $139.5.
The MACD formed a bullish crossover in bear territory- a weak buy signal. The OBV showed that over the two weeks, buying volume has outpaced selling volume. While a series of higher lows were seen, higher highs were not posted on the OBV- buyer interest is present, but not in overwhelming amounts yet.
A new high would need to be registered on the OBV for XMR to recover and rise above $160 once more.
OMG Network [OMG]
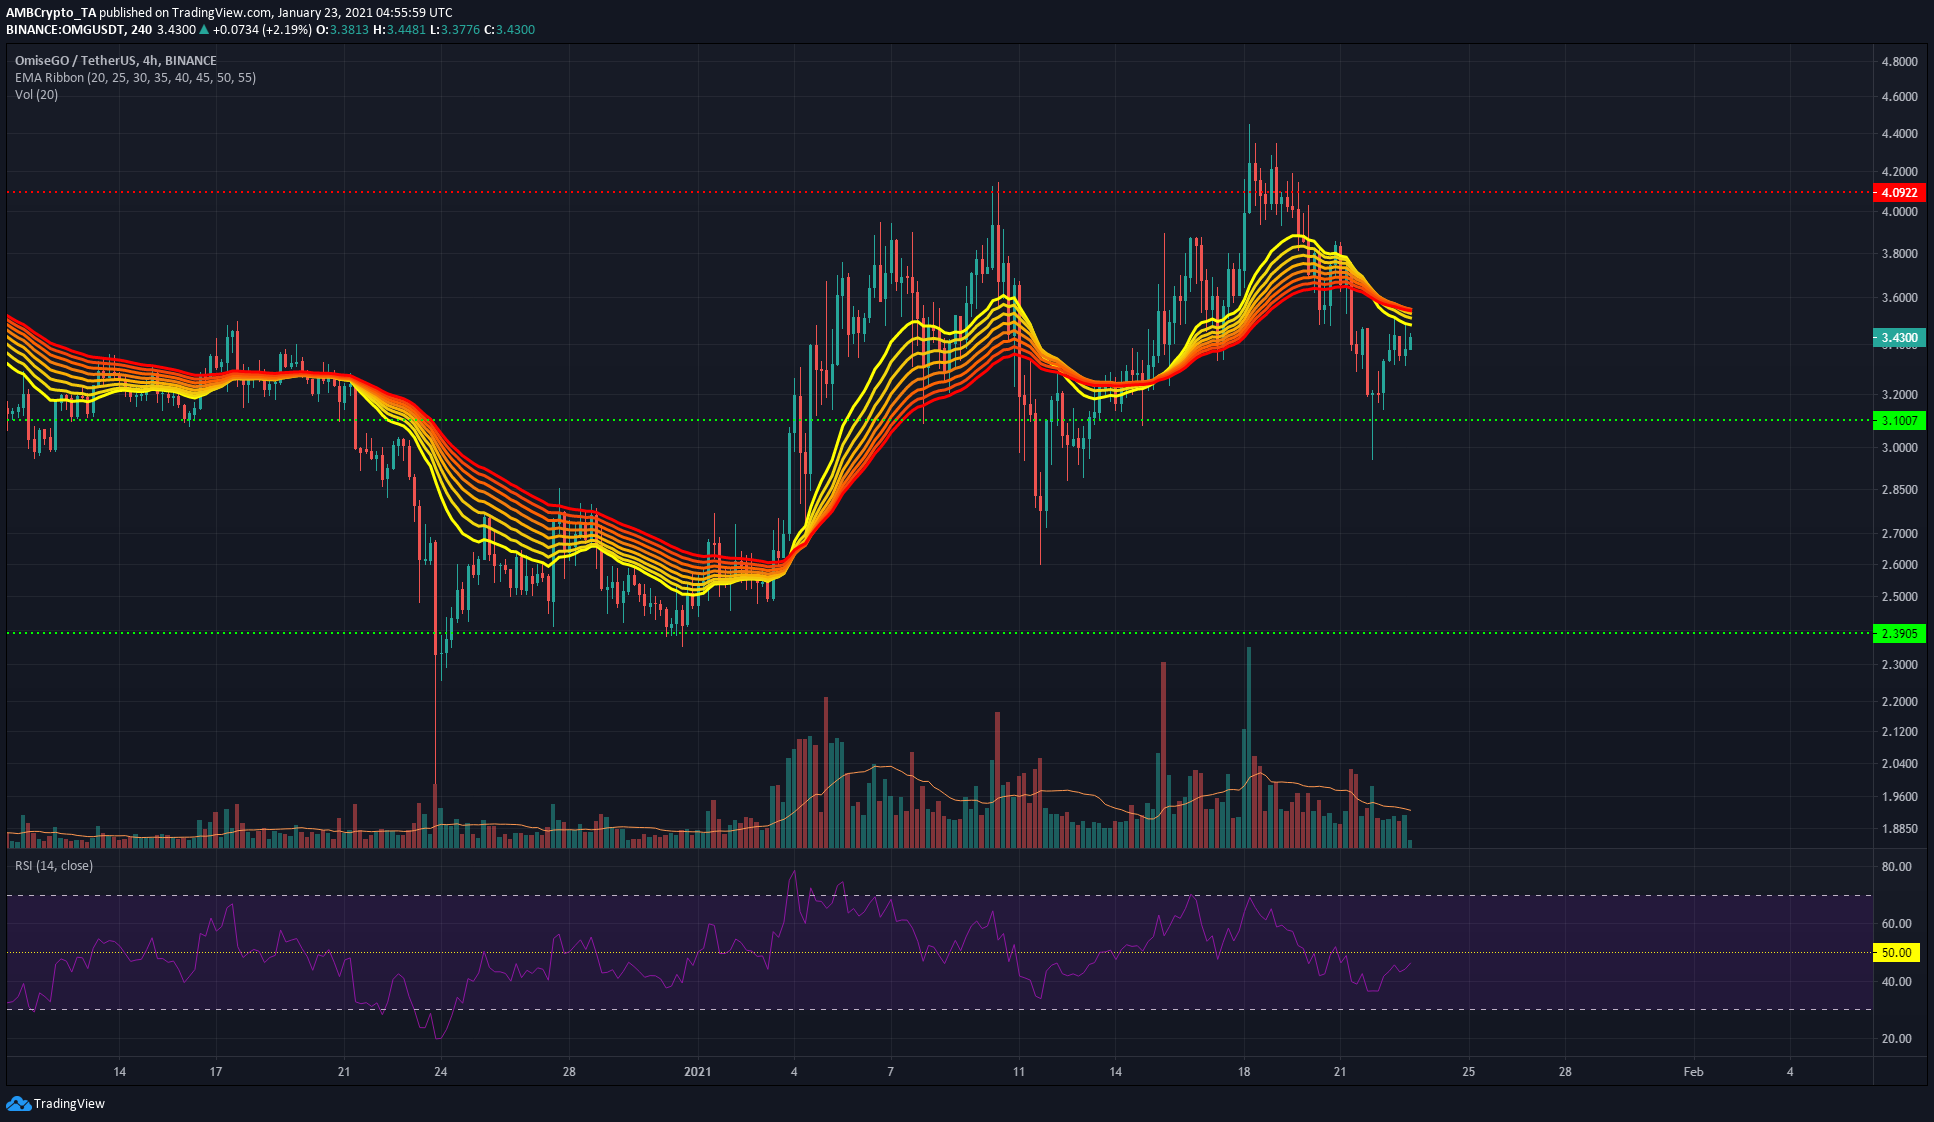
Source: OMG/USDT on TradingView
OMG’s price was moving under the EMA ribbons and could face resistance from it in the vicinity of $3.6. The RSI was under 50 and has been over the past few days, denoting bearish pressure.
OMG would need to rise above $3.6 and stay there, and the RSI needs to rise above 50, to signal a move to test the resistance at $4.1. A rejection at the $3.5-$3.6 region would see OMG retreat back toward the $3.1-support level.
Trading volume has been below average on OMG’s bounce, and this would need to pick up to signal a move upwards as it would signify market conviction. Low trading volumes even as OMG approaches $3.6 would likely see sellers step in to drive the price down.
DigiByte [DGB]
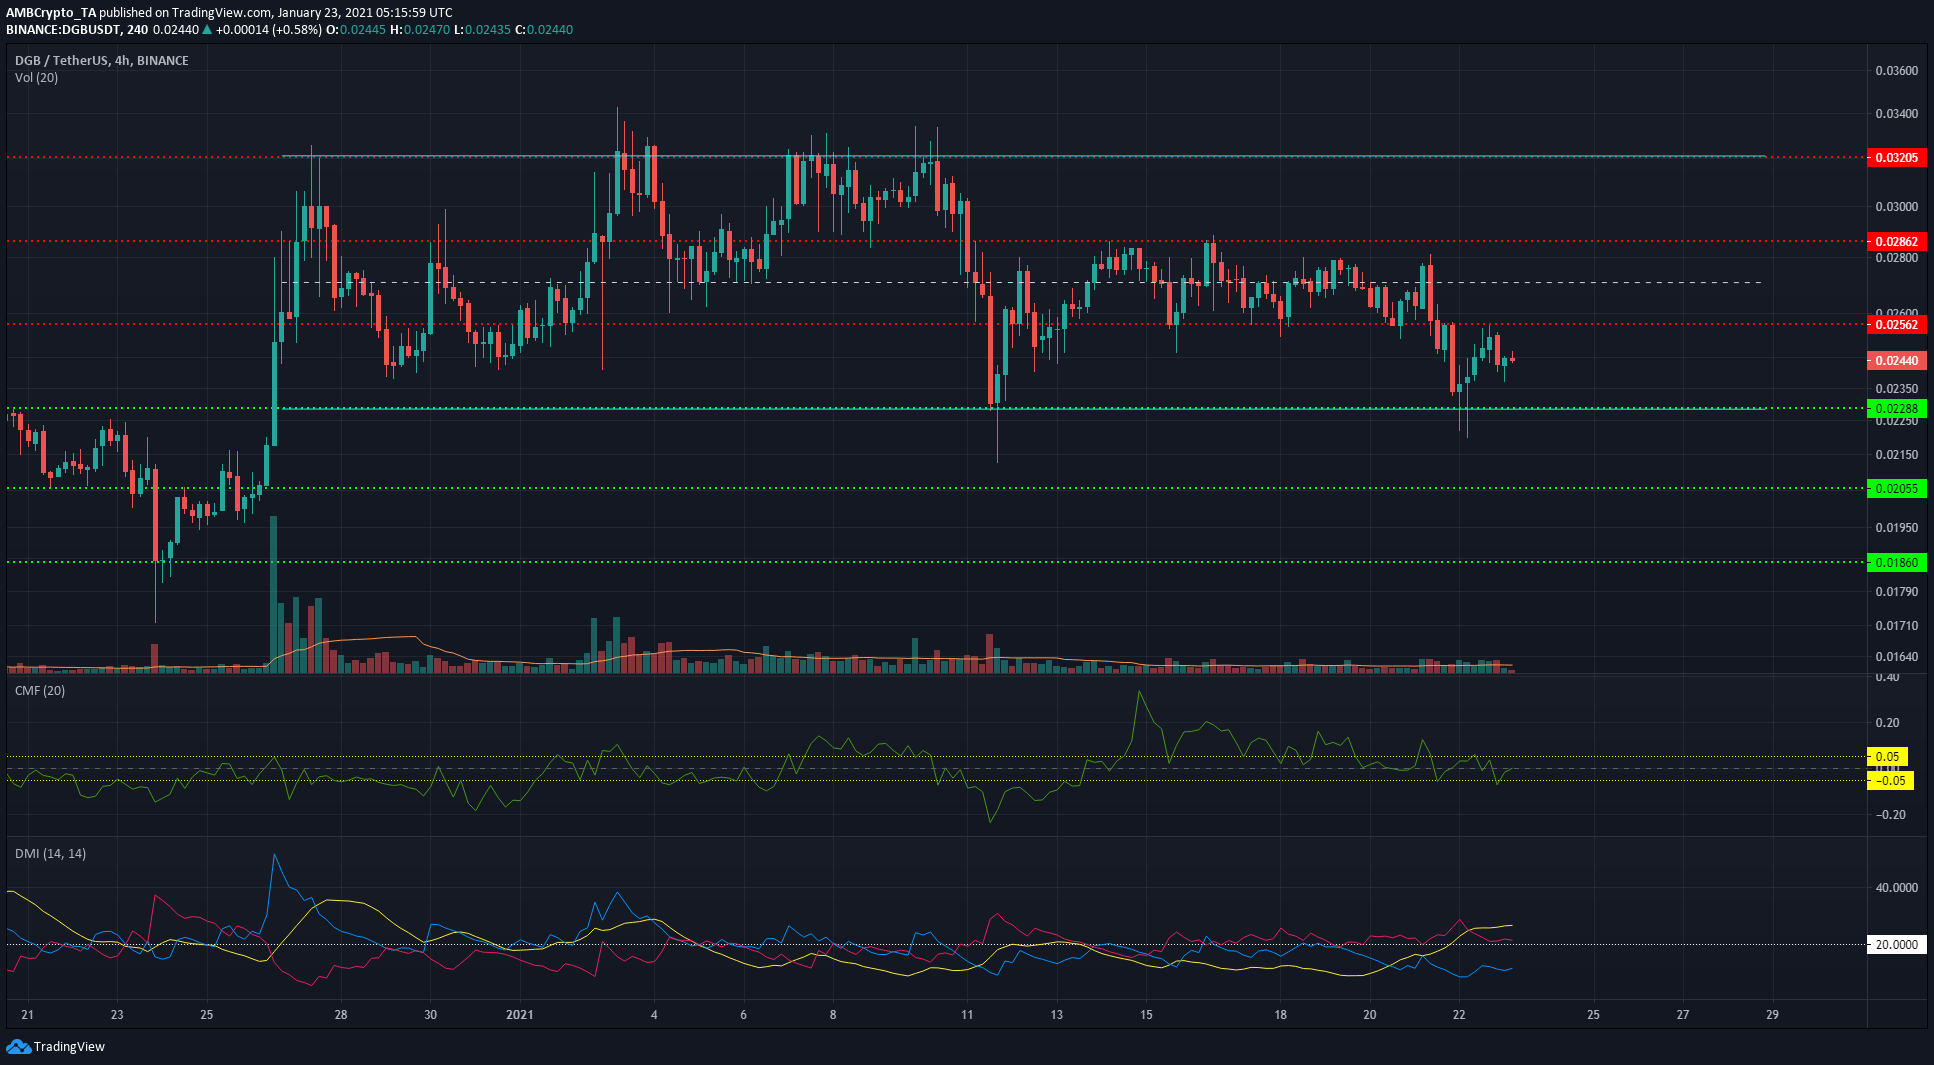
Source: DGB/USDT on TradingView
DGB has traded within a range of $0.22 and $0.32 since late December. This is likely to continue as DGB bounced of the range lows to test the resistance at $0.256 over the past two days, but was rejected at this resistance.
The Directional Movement Index showed a strong bearish trend in progress as both the -DI (pink) and the ADX (yellow) were above 20. Further, the Chaikin Money Flow was in neutral territory.
The selling pressure of the past week saw DGB slowly decline from the $0.286-level and this could be set to continue.


