Monero was trading at a take-profit level; can bulls push the price past this area of supply

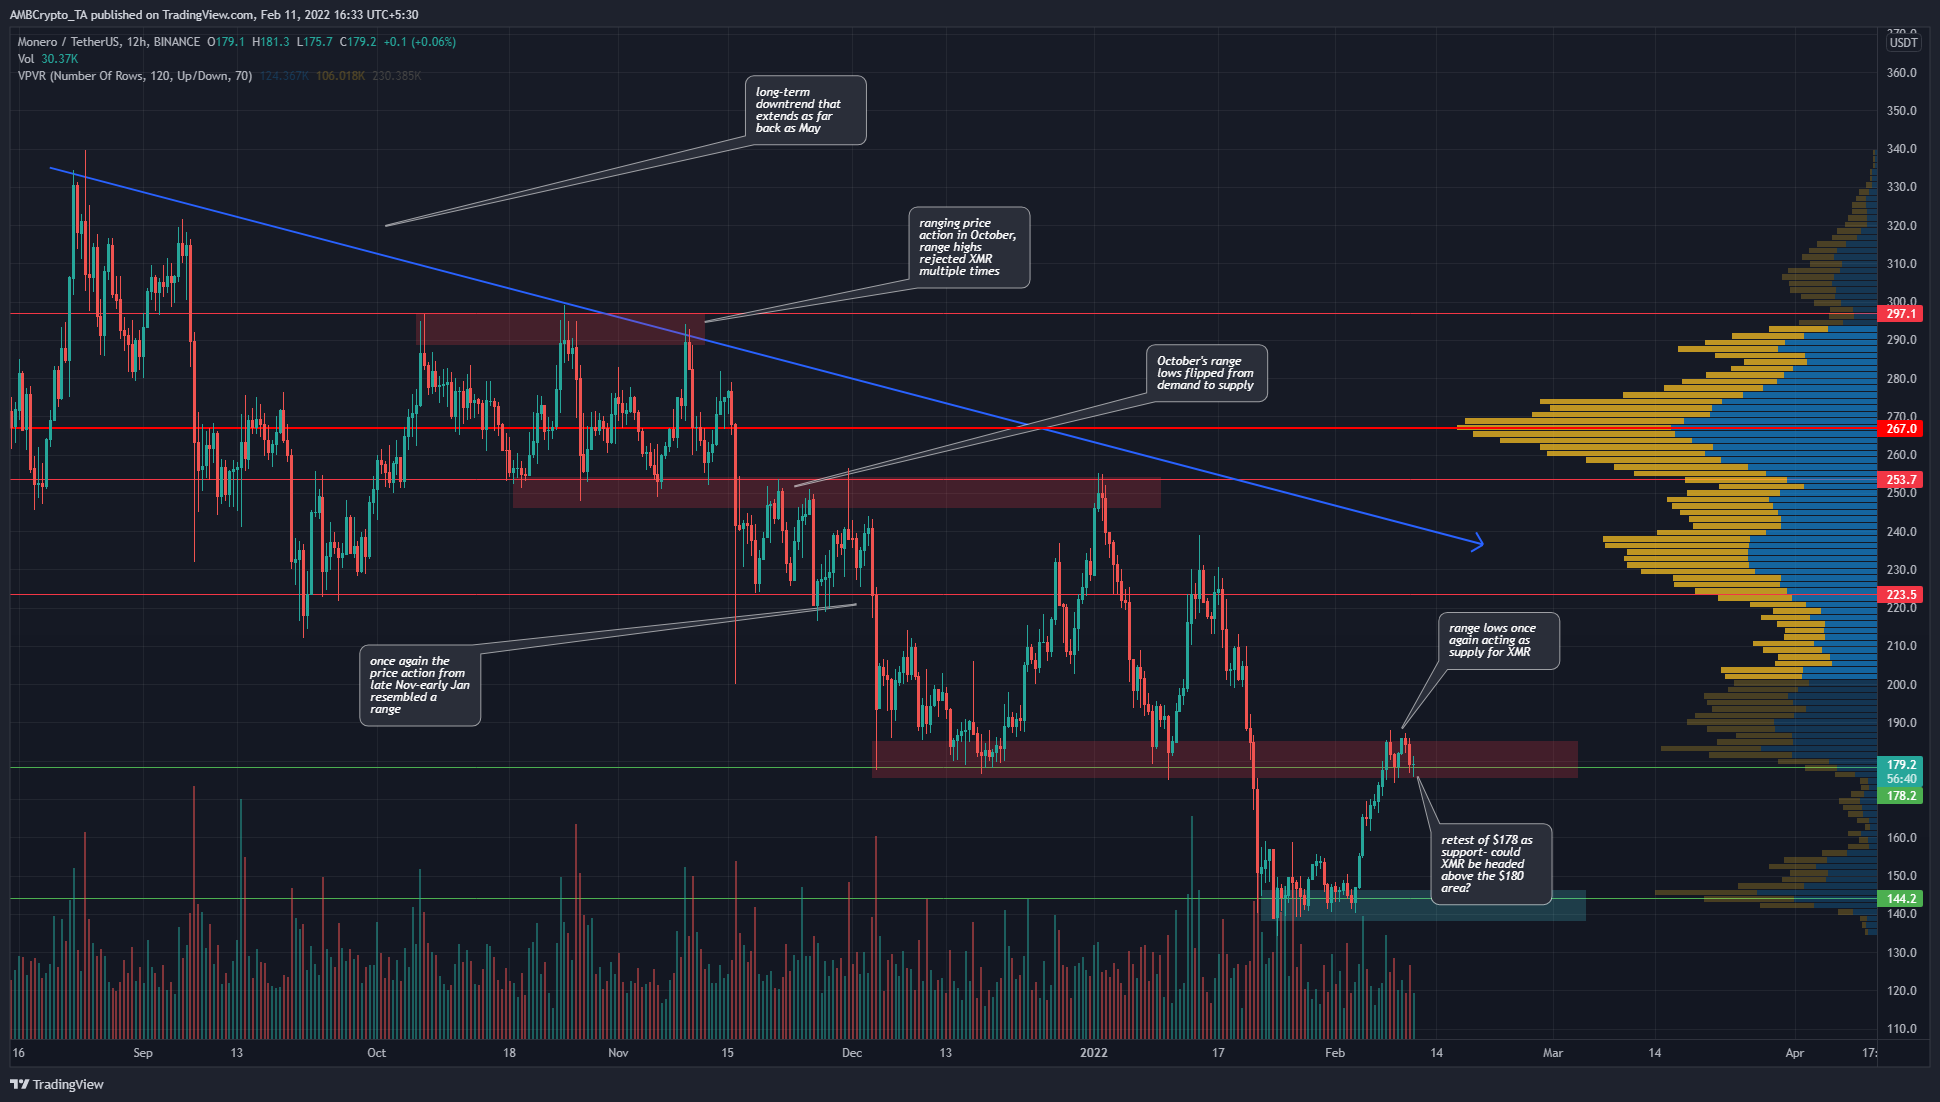
One of the leaders of the privacy coin sector, the price of Monero has taken a beating on the charts. A few months ago, Kraken had to delist Monero due to regulatory compliance reasons in the UK. News such as these could deflate investor confidence in the coin. At the time of writing, the coin was trading at an area of supply at $180- but bulls might be forced to retreat once more.
XMR- 12H
In May 2021, the price of Monero shot to $519 per coin, but since then, it has registered a series of lower highs on the charts. Since September (chart above) the direction of the price has been southward, with periods of ranging price action in between.
Bitcoin’s bullish movement in the past two weeks has helped XMR bounce from the $140 area all the way to $180. Whether XMR bulls can push the price past this area of supply, which was formerly demand in December and January, remained to be seen.
The continuation of the former trend would be a rejection at this area of former demand. Yet there is not much evidence to suggest a rejection would occur. The next few days would be necessary to assess the next direction of XMR.
Rationale
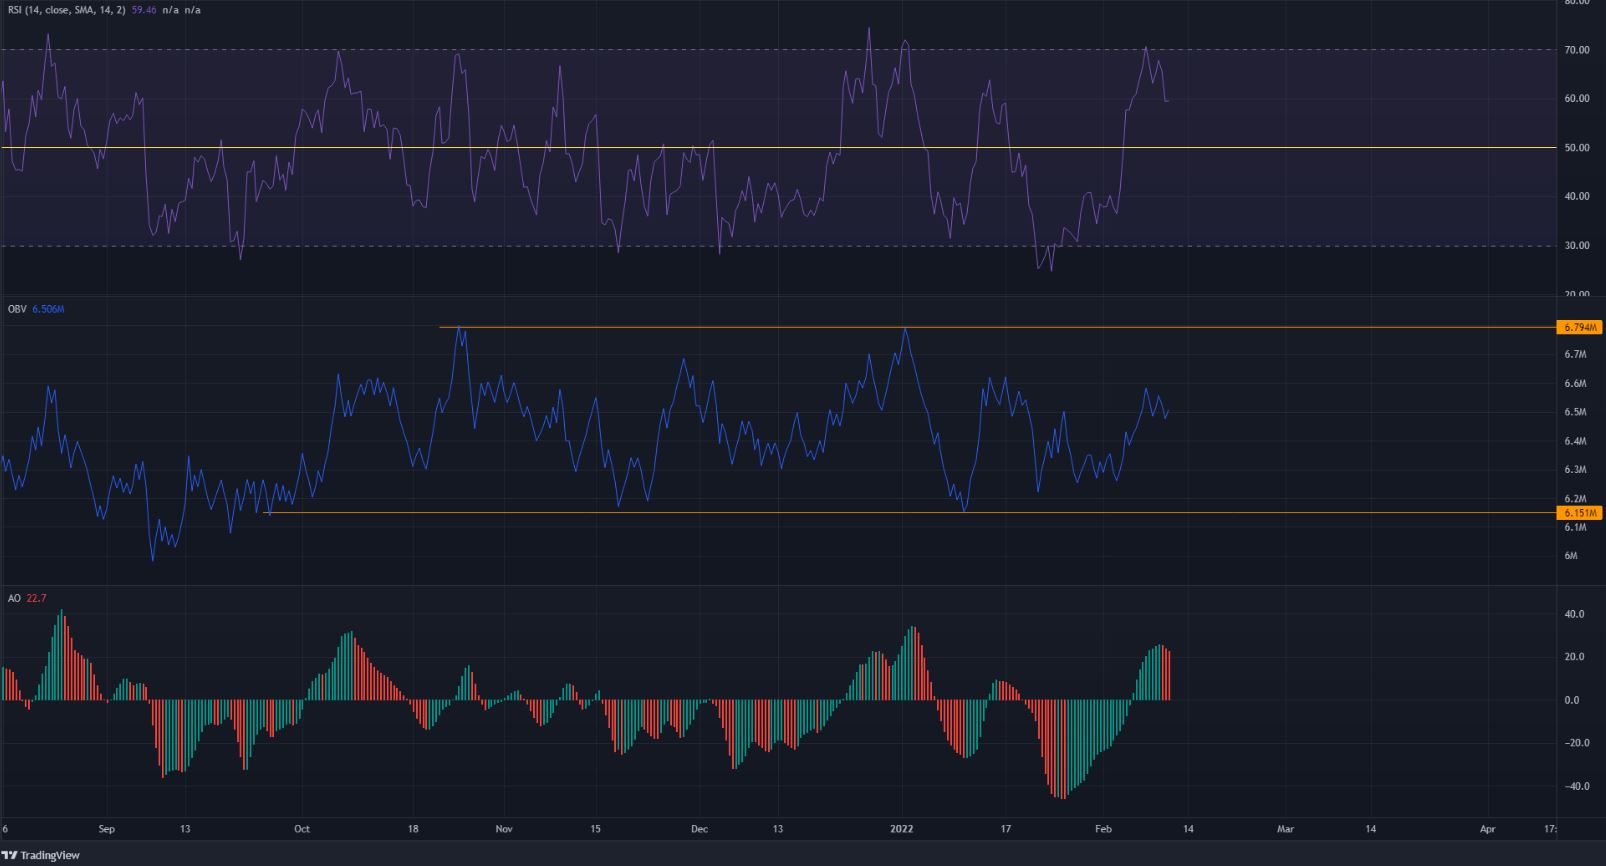
The RSI on the 12-hour chart has climbed back above the neutral 50 in the past couple of weeks, a sign of bullish momentum. But this by itself does was not indicative of XMR’s next direction, in the larger picture. For example, the RSI climbed to 70 in late December/early January when the price tested the $250 area and faced rejection. Considering how the price has had a habit of forming ranges before its next leg downward, the next few weeks could see both the RSI and the price dive lower.
The OBV has also been stuck within two levels marked on the chart, which meant that the buying and selling volume of the past few months has been balanced. This was a bit of a disagreement with the price, which has consistently formed lower highs.
The Awesome Oscillator showed waning bullish momentum at the time of writing, and in general, has spent the majority of the time since September beneath the zero line.
Conclusion
XMR was not trading in an area where buying was a sensible idea. Rather, it was at a logical take-profit level. A retest of $179-$180 as support after a move up could be a buying opportunity, with a tight stop-loss.


