
Monero continued its rangebound movement between $239.4 and $215. Zcash showed weakness after recapturing the 23.6% Fibonacci retracement level, while a breakdown on Chiliz could highlight support levels at $0.29 and $0.156.
Monero [XMR]
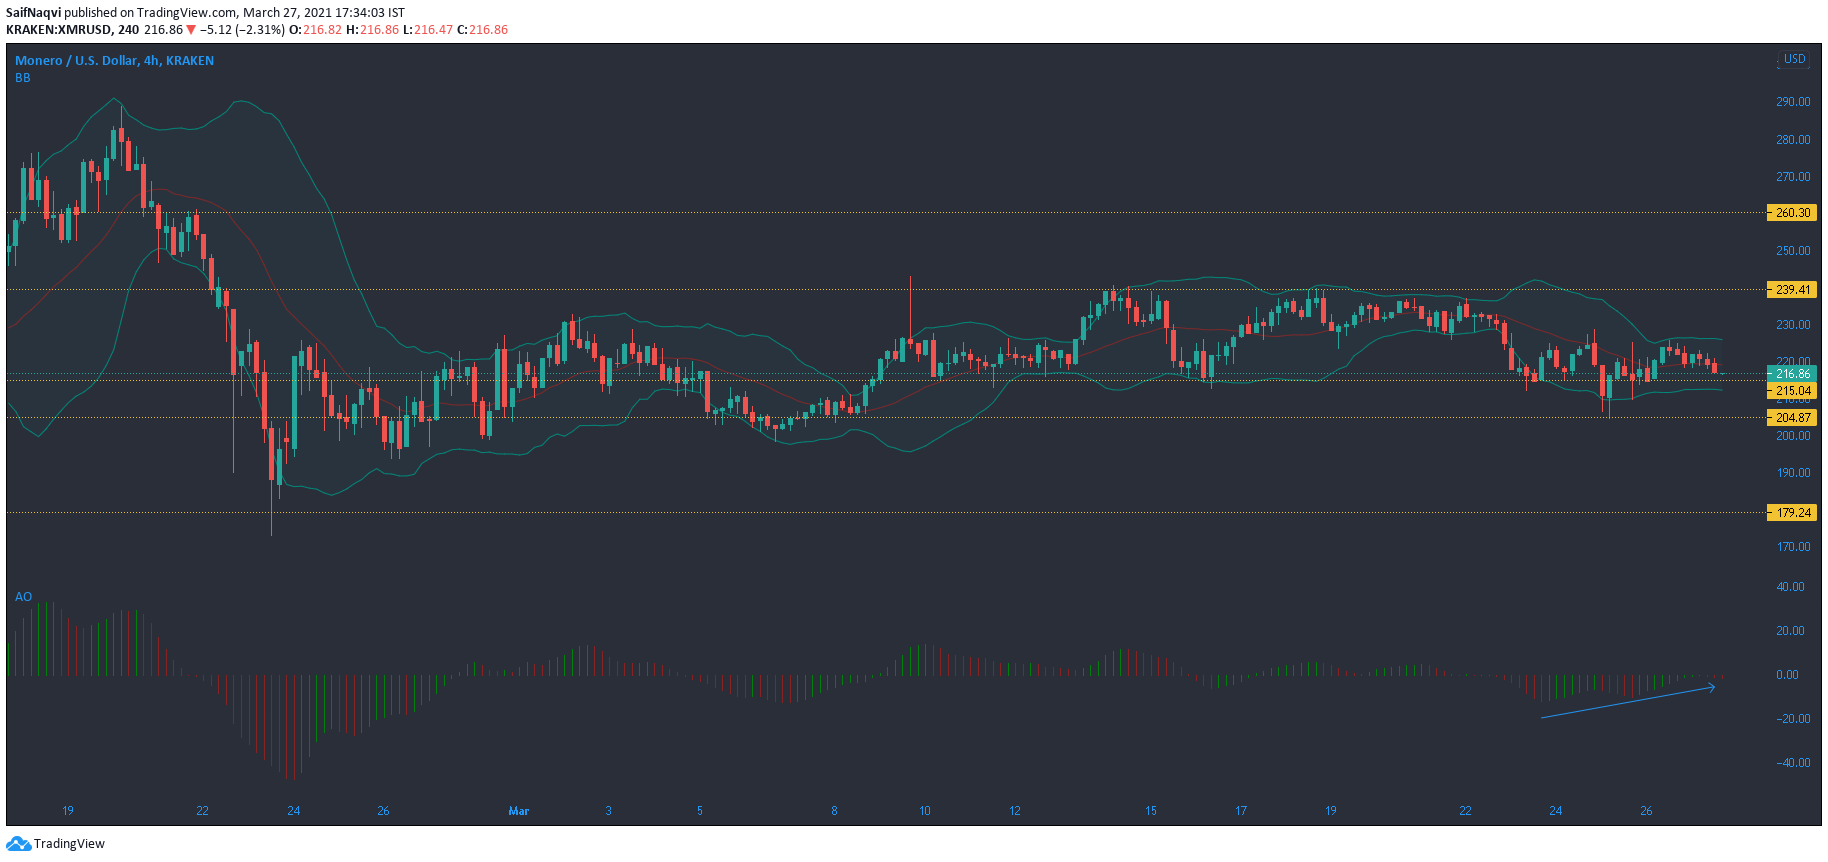
Source: XMR/USD, TradingView
With limited price swings during the month of March, it was possible that Monero was in an accumulation phase post the pullback in late-February. The region between $239.4 and $215 showed strong price oscillation as the buyers and sellers maintained equilibrium in the market. Low volatility, according to Bollinger Bands, meant that sharp movements were unlikely for XMR over the coming sessions.
Even though Awesome Oscillator formed a bullish twin peak, momentum was expected to be restricted considering the current state of the market. Post the accumulation phase, a breakout above the press-time resistance would likely lead to extended gains towards the $260-level. Conversely, a breakdown from the current level would highlight the next line of defense at $205.
Zcash [ZEC]
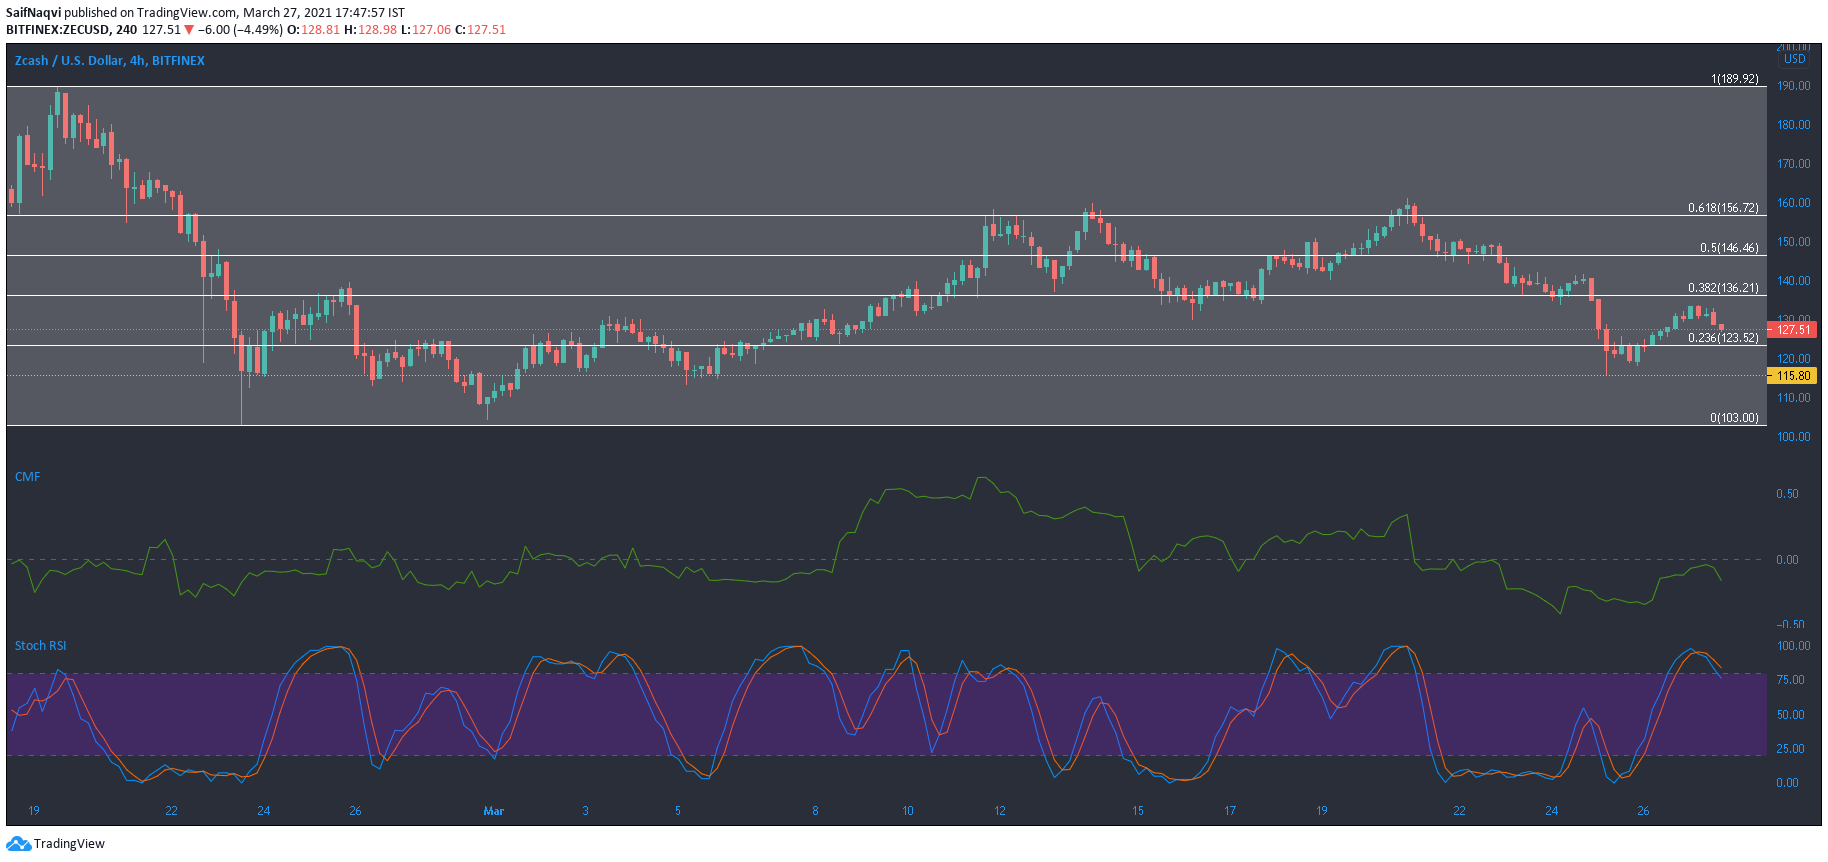
Source: ZEC/USD, TradingView
Gains over the past couple of days helped Zcash rise above the 23.6% Fibonacci retracement level, but some weakness was seen in its price at the time of writing. Stochastic RSI pointed lower from the upper region, suggesting a minor pullback. A dip below the current Fibonacci level would likely lead to an extended sell-off, with the bulls expected to fightback at $115.8-support.
Meanwhile, Chaikin Money Flow suggested that capital outflows may have accentuated recent losses in the Zcash market. CMF’s failure to recover above the half-line reflected in lower levels for ZEC as well.
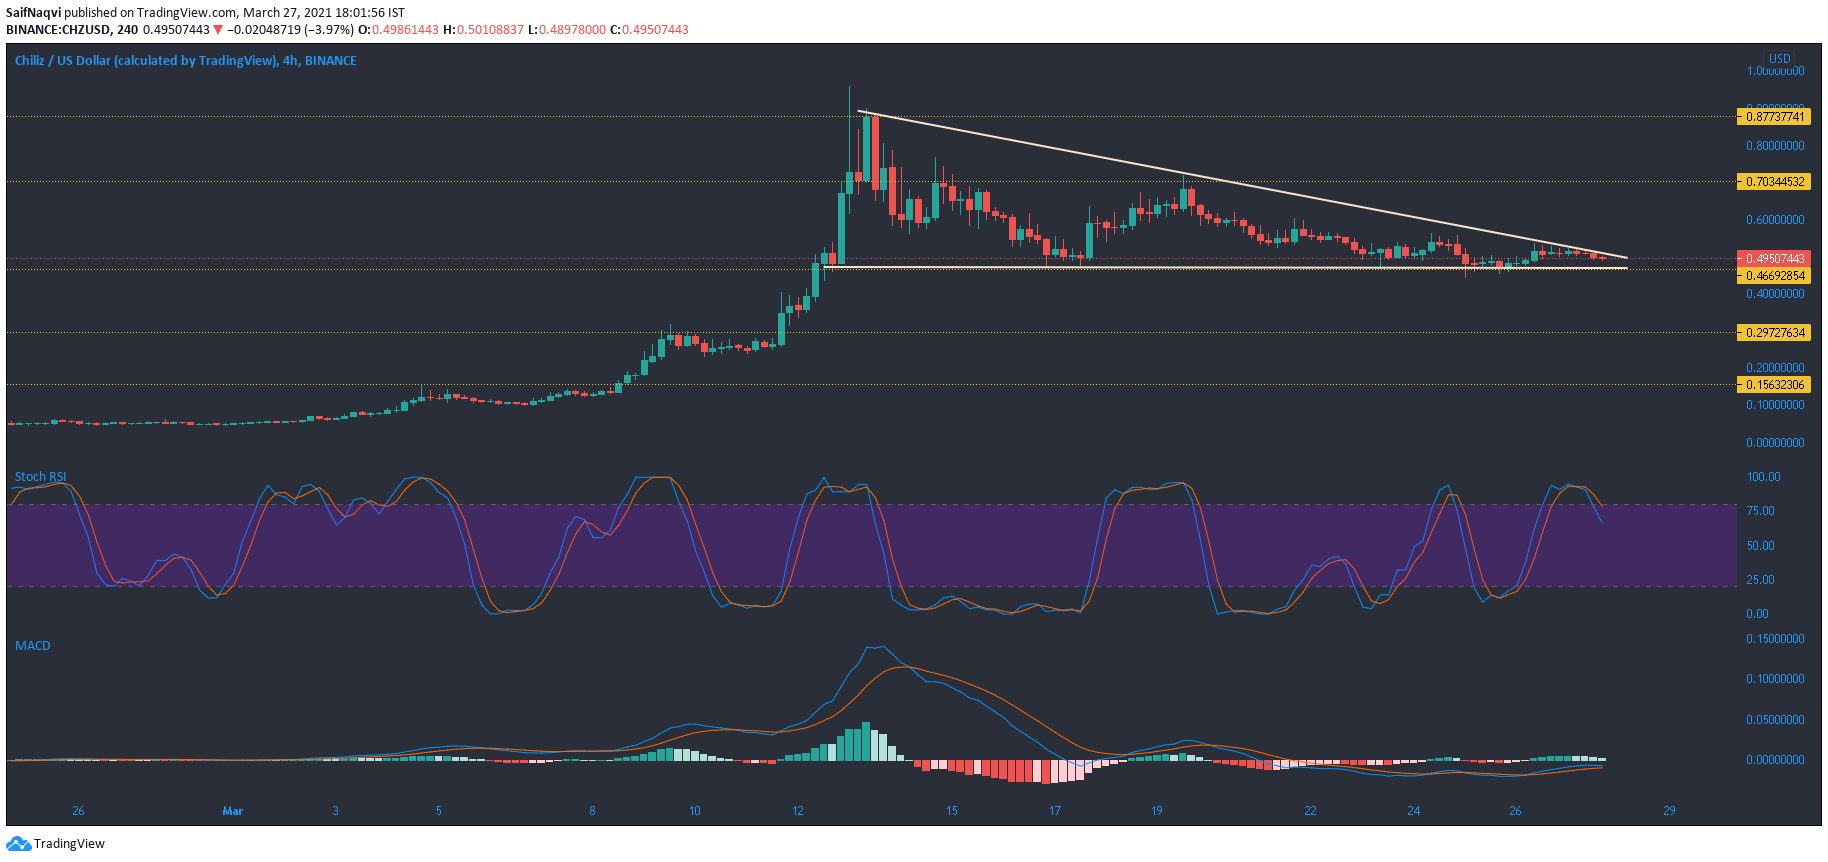
Source: CHZ/USD, TradingView
One of the best performers of 2021 so far, year-to-date gains in Chiliz amounted to a stupendous 2287.8%. However, since touching record levels, the price cooled off and the later half of March saw the cryptocurrency stabilize at lower levels. During this process, a descending triangle emerged on the 4-hour timeframe, one that is characterized by lower highs and steady lows. While the price usually breaks down from this pattern, a bullish move was even possible considering its price action during the first three months of 2021.
An upwards breakout would put levels at $0.7 and $0.87 under the spotlight. Meanwhile, a breakdown could go as low as $0.29 or even $0.15. A bearish Stochastic RSI only reinforced the idea of a bearish outcome. MACD’s histogram also showed weakening momentum, even as the fast-moving line moved above the Signal line.