More losses for Polkadot, but is there an opportunity going forward

Disclaimer: The findings of the following analysis are the sole opinions of the writer and should not be considered investment advice
Polkadot has followed in the steps of Bitcoin over the past week. The 3% loss that Bitcoin saw in the 12 hours prior to press time was also reflected in Polkadot’s price. However, the losses were amplified as DOT lost 8.4% over the same time period.
When altcoins lose significant value after Bitcoin has a small move down, it is usually a sign that the overwhelming altcoin sentiment is fear. Hence, the selling.
Polkadot – 1 hour chart
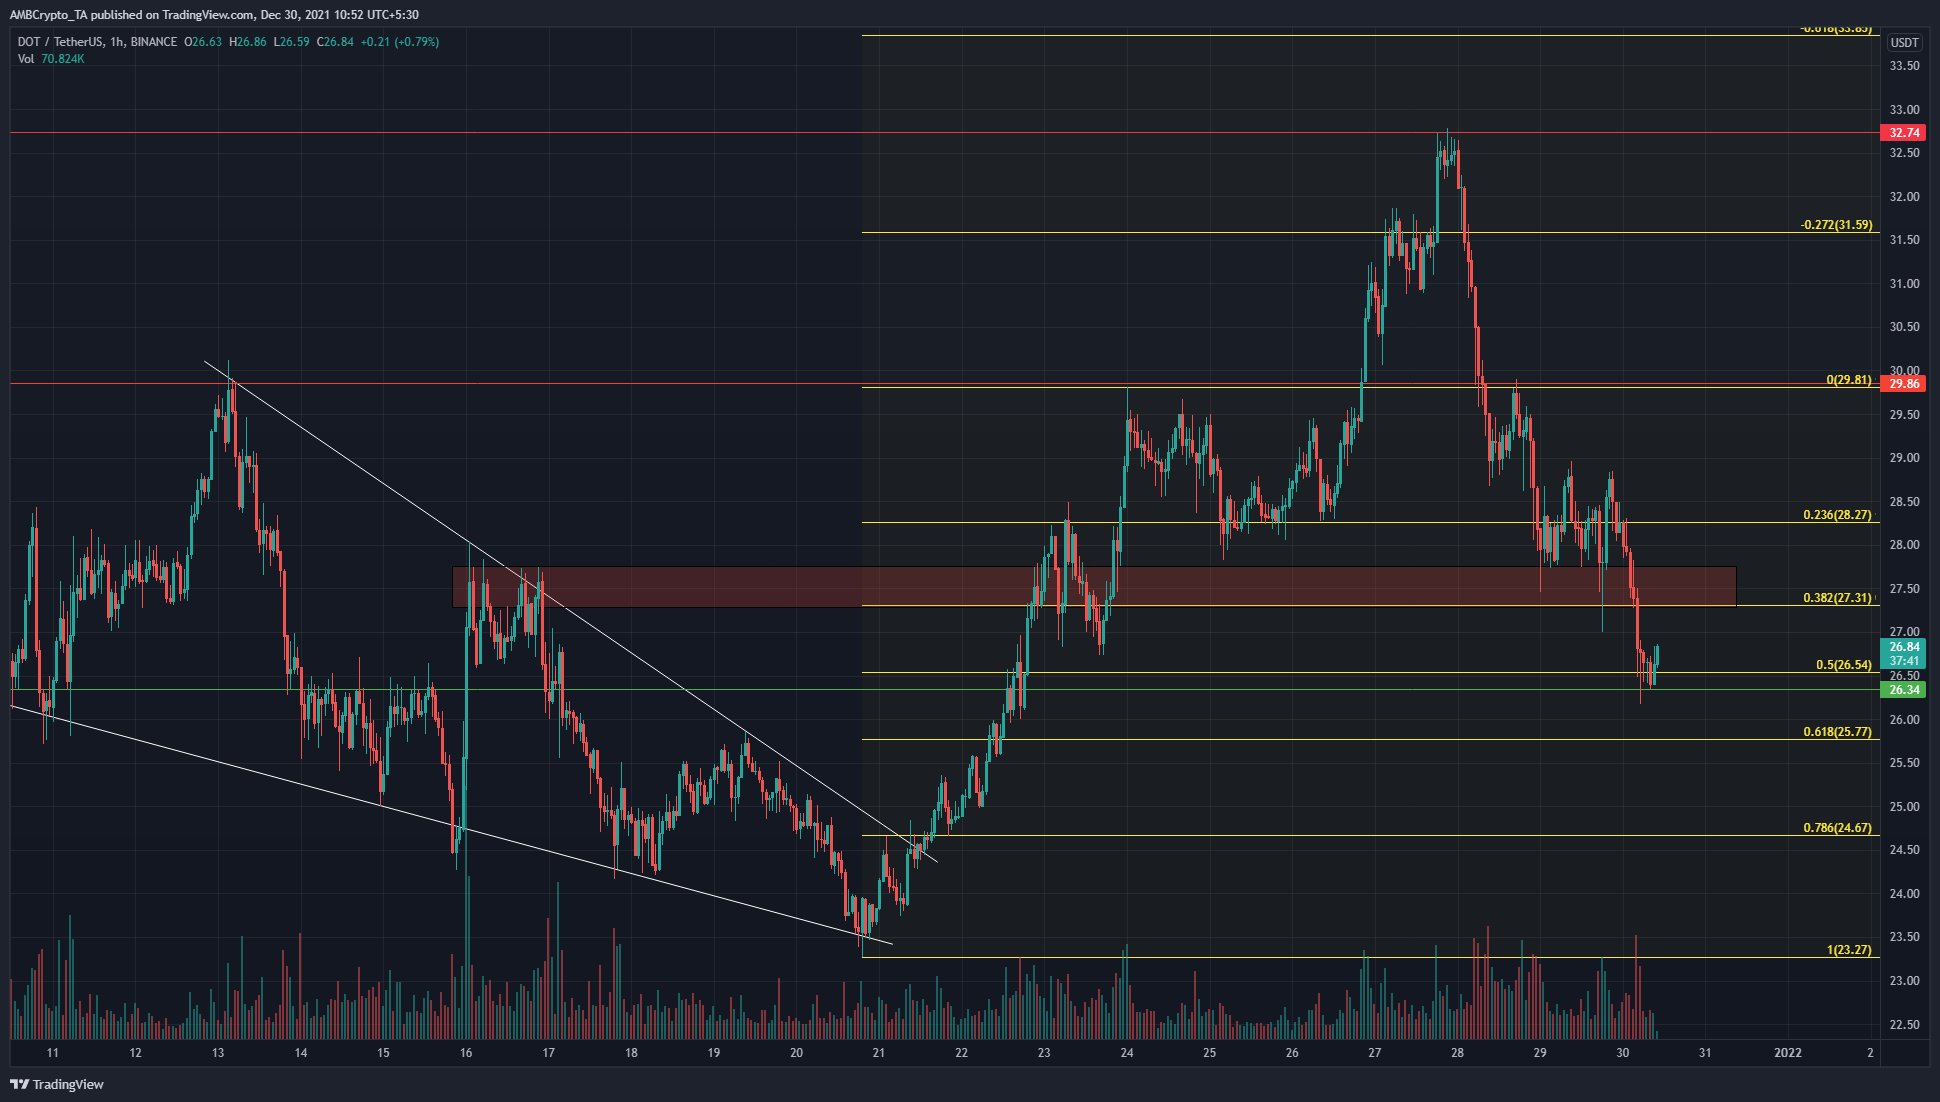
The Fibonacci extension levels showed a move to $33.8 was possible, but the longer-term resistance at $32.7 was not overcome.
The Fibonacci retracement levels plotted held decently well as support, with the $26.34-level also being a longer-term support level. The price lost $29.8 as support and retested it as resistance a couple of days ago, foreshadowing the move down.
The $27.5 area (red box) was a place where buyers would have stepped in with confluence as the 38.2% retracement level expected to act as support as well. However, buyers were exhausted (two long lower wicks) and sellers were able to push the price to the $26.5-level.
A brief relief rally to $27.3 can be expected, before another leg south.
Rationale
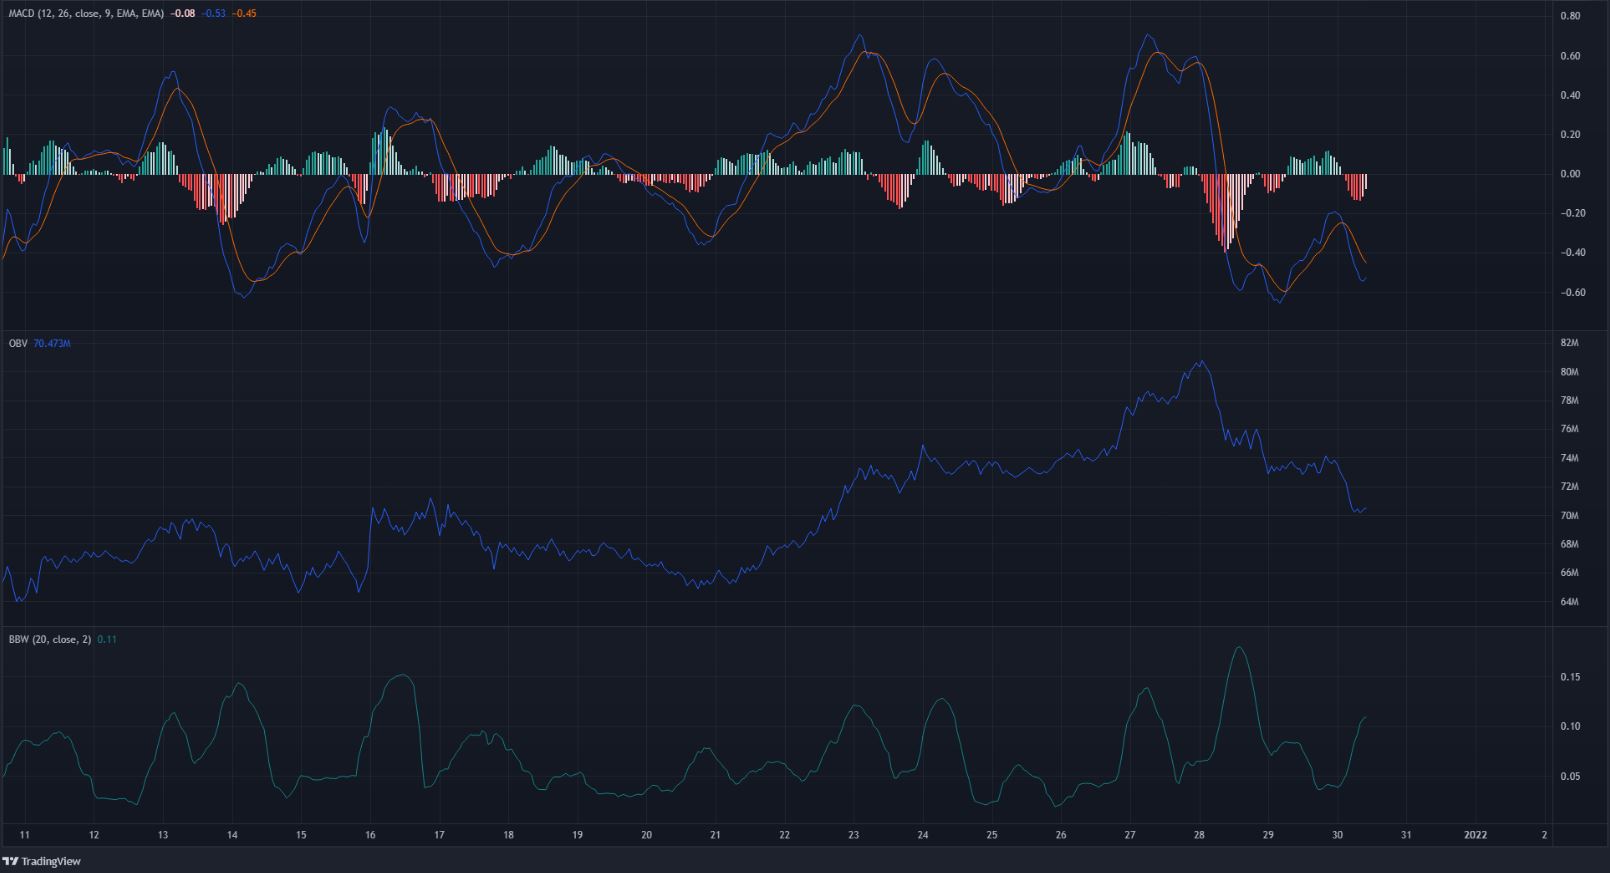
The OBV has been falling over the past few days, a sign of selling volume. The MACD also crashed beneath the zero line to show that bearish momentum had been strong recently. The Bollinger bands width indicator was climbing. This was a sign that volatility was on the rise, which was a fact reflected on the price charts.
This volatility is likely to continue. The $27.3-$27.6 area has been significant recently and offers liquidity. Contrarian traders would be conniving to profit off the bounce and the red box offers an opportunity for underwater longs to be closed, as well as for new short positions to be opened.
It is quite unlikely that buyers would somehow be able to drive prices higher and flip $27 to demand. What appeared more likely, ergo, was a test of $27, and a one-sided contest between the bears and the bulls.
Conclusion
The lack of strength from buyers could see Polkadot plunge lower on the charts once more. Bitcoin has some bearish momentum behind it and losing $45.8k could see it drop lower. This might set up a good opportunity for short-selling on DOT.