Once Ethereum Classic smashes past this resistance zone it will…

A 14% jump over the last 24 hours allowed Ethereum Classic to shatter past the 23.6% Fibonacci level. Considering the RSI’s overbought nature, a minor retracement was expected at $53.7 resistance but buyers can punch back at $50 and set ETC onwards to the 50% Fibonacci target.
An extended push above the 61.8% Fibonacci level was also possible provided ETC is able to smash past a crucial resistance zone.
ETC 4-hour Chart
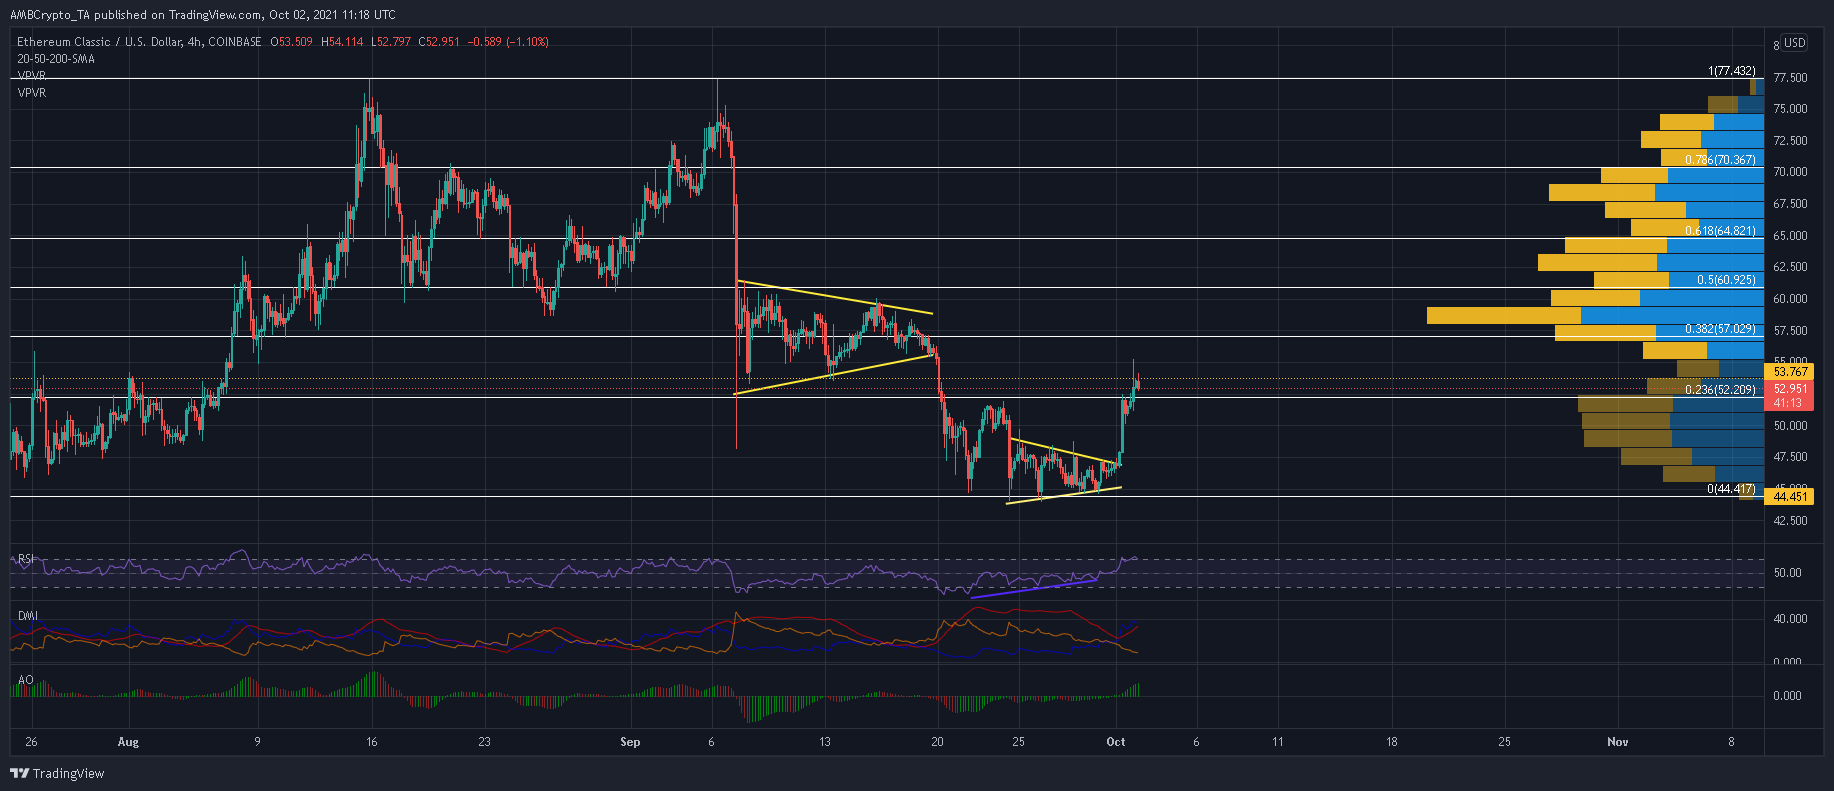
ETC extended its gains above the 23.6% Fibonacci level on the back of a symmetrical triangle breakout. Impressively, broader market sentiments seemed to be favored over bearish signals arising from a death cross on ETC’s daily chart.
As buyers press home their advantage, a rise towards the 38.2% Fibonacci level can be achieved with relative ease. This was made prominent via the Visible Range which highlighted weak resistance levels between $52-$57. However, ETC journey from $57 to the 50% Fibonacci level was riddled with a substantial amount of selling pressure. Expect a few corrections within the aforementioned region as investors book their profits.
Meanwhile, ETC did need to scale past some near-term hurdles to assert dominance. For instance, a resistance zone between $57 and Visible Range’s POC at $58.6 could look to deny ETC’s advance. Scalping was also a threat within this region.
Reasoning
Interestingly, ETC’s Awesome Oscillator alerted observers of a symmetrical triangle breakout after forming a bullish twin peak setup. The index was currently trading at its highest level in over 3 weeks. The Directional Movement Index ‘s bullish crossover also coincided with this breakout, while an ADX reading of 32 indicated more upside potential. However, the RSI’s overbought readings did present chances of a near-term decline, especially since the price traded close to $53.7-resistance.
Conclusion
ETC was expected to dip slightly from the $53.7 price barrier and rebound immediately after the RSI stabilizes. From there, ETC’s journey to the 61.8% Fibonacci level depended on how the price would interact with a resistance zone of $57-$58.6.