Only a matter of time before Bitcoin does this

There are a couple of things that have been clearly evident for Bitcoin’s market over the past week. Volumes significantly dried up in the market, and volatility was getting squeezed in the market. On-chain metrics facilitated a flat curve as well, so at press time, it was difficult to gauge a reactionary change for Bitcoin in the short term.
However, a few indicators seemed to be suggesting an incoming change, irrespective of the press time silence on the price charts.
Liquid Supply Ratio hike and Coin Liveliness
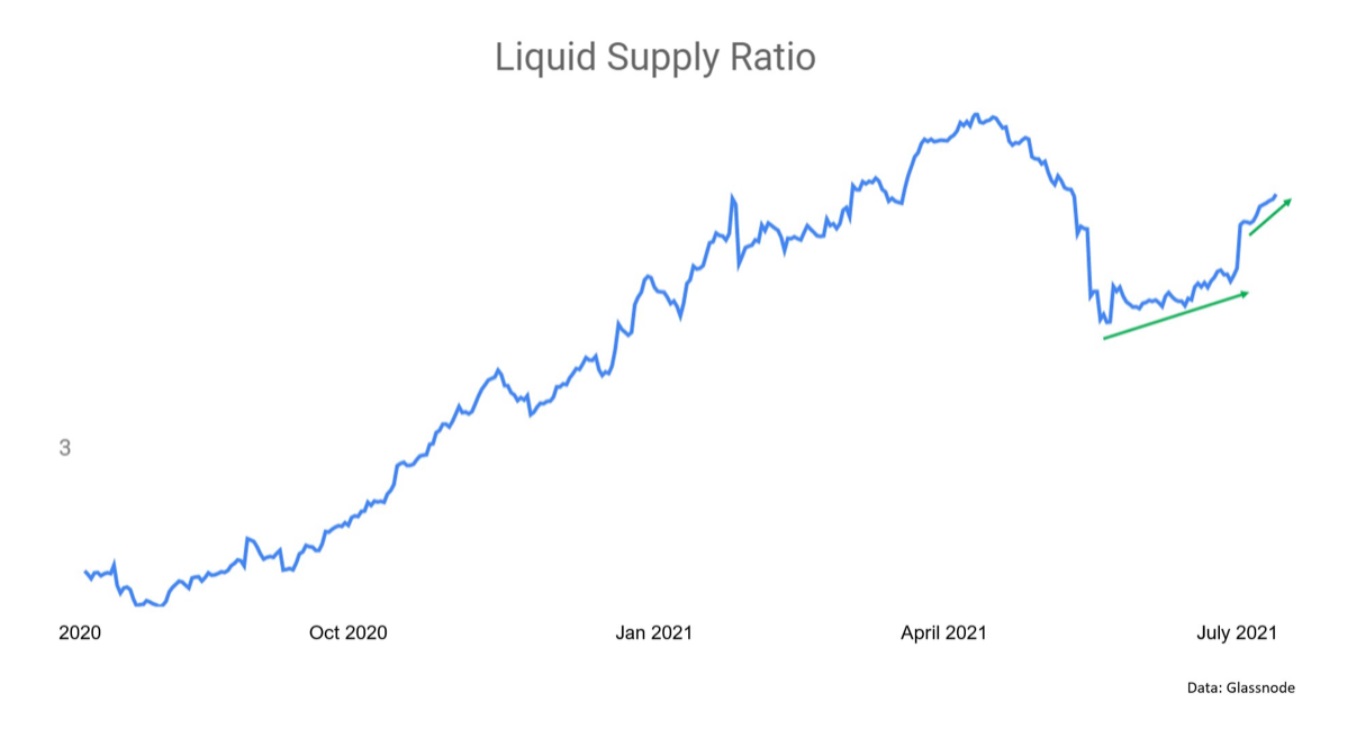
Bitcoin’s accumulation has been explained through various metrics over the past few months, but a qualitative way of understanding the supply is the flow of the Liquid Supply Ratio. When tracking the illiquid supply change, it was observed that at press time, the same has been on an uptick since the end of June, an observation that meant that a supply shock was still an option.
Now, another key indicator that can be used to analyze the broader trend is Coin Liveliness. Coin Liveliness is basically the ratio between coin days destroyed and coin days created.
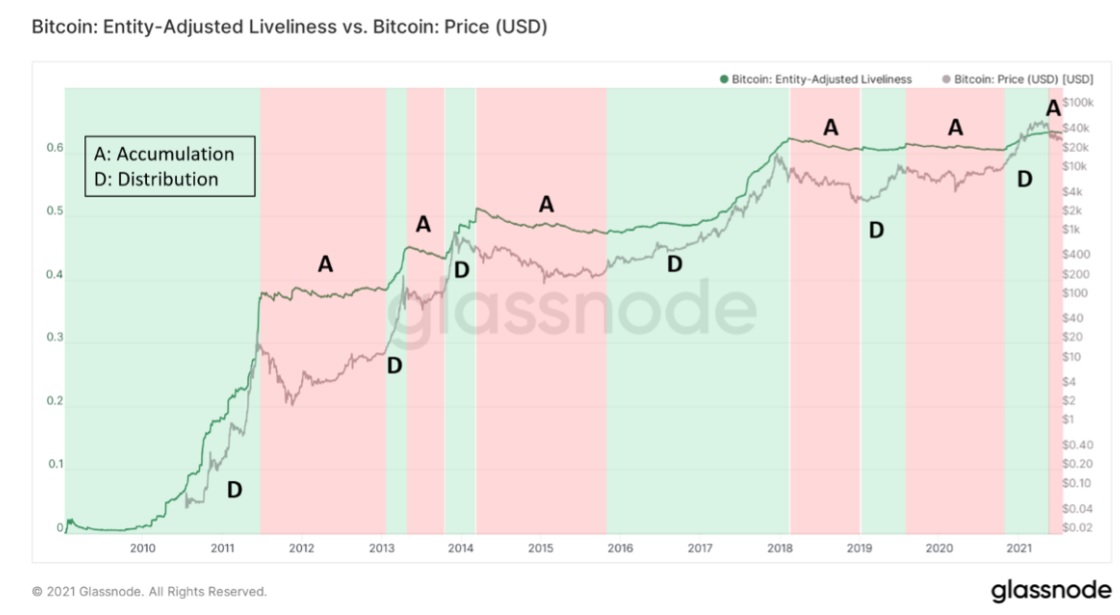
Now, according to the chart above, the downtrend seemed to point towards a phase of accumulation for Bitcoin and historically, it has led to a series of rallies. However, it is important to note that an accumulation can last for a longer period, one during which the price can experience a massive drop.
And yet, factually, Bitcoin’s UTXO distribution between $31k-$35k is a significant signal. According to data, 9.94% of BTC’s money supply has moved between the aforementioned range, with the same improving to 17.55% for the range of $31k-$40k.
Such high entity movements within a rigid price range allow the asset to consolidate between those particular price-points, so it opens the idea that BTC’s bottom could be in. The fact that BTC had fallen below $30k at press time does not necessarily discount that observation either.
Bitcoin Red Flag lookout?
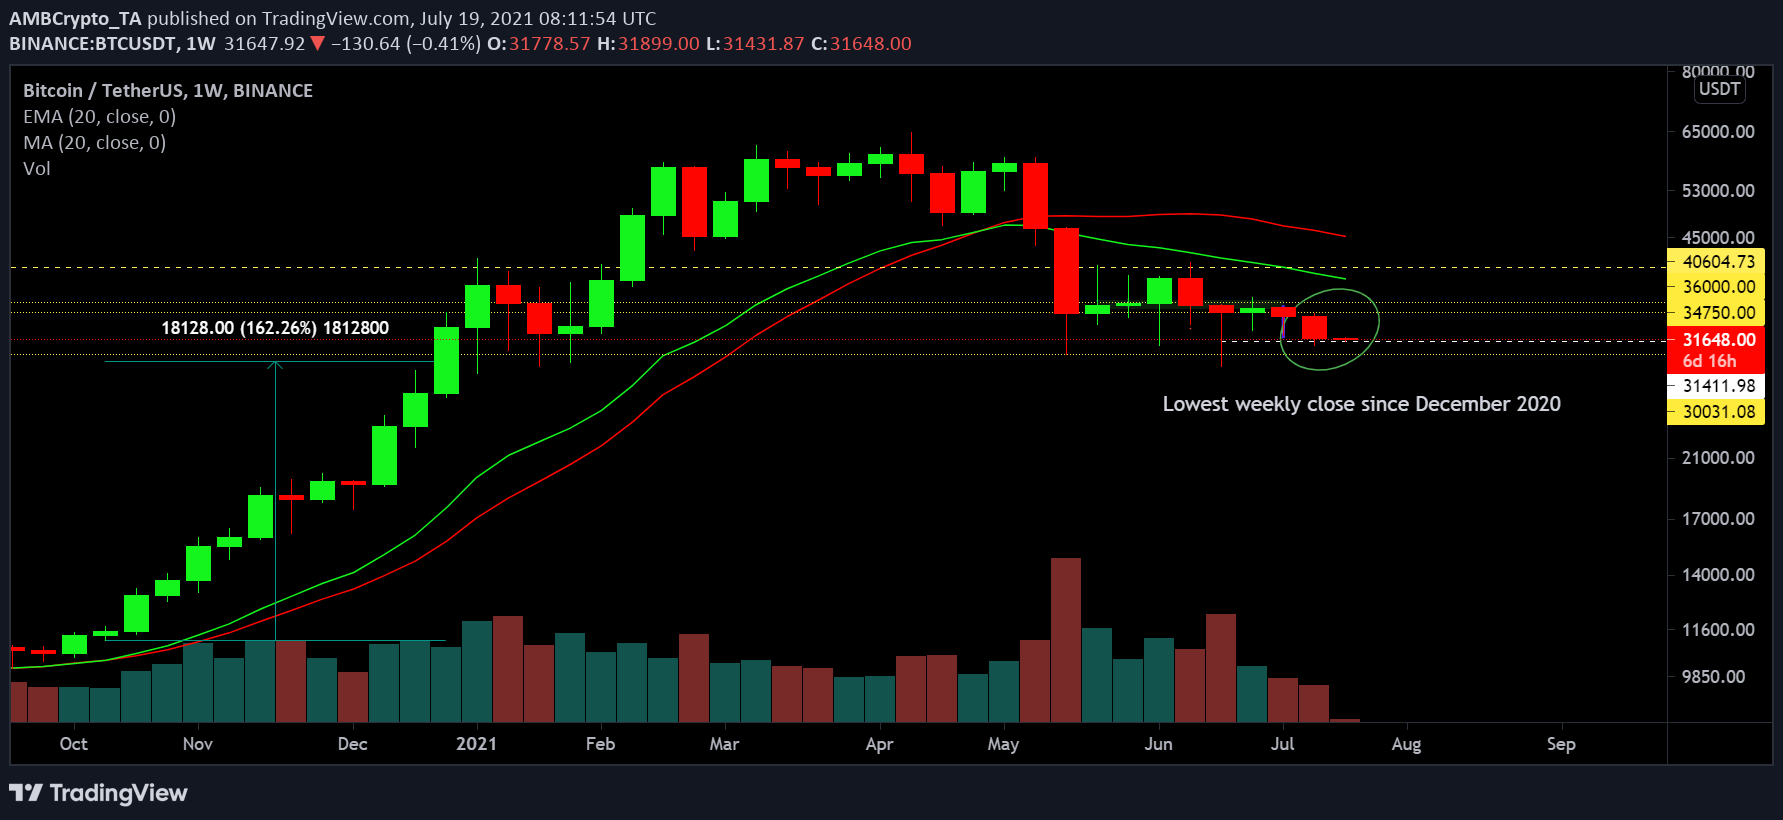
Now, analyzing the market on a weekly scale, the charts did not look very optimistic. Bitcoin closed its lowest candle since December 2020. Ergo, BTC is meddling with its key weekly support. Under $31500-$30,000, the asset does not have any rigid price support and theoretically, it could topple down all the way to $24,000.
And yet, it can be expected that the bounce back will be dominant since most on-chain metrics cannot be collectively false about a bullish recovery. It is only a matter of when and how it is going to kick in.