Optimism bounces off range low – can bulls push on?

Disclaimer: The information presented does not constitute financial, investment, trading, or other types of advice and is solely the writer’s opinion.
- Optimism bounced off a range low to present a buying opportunity for bulls.
- Buyers encouraged by slight margin in futures market.
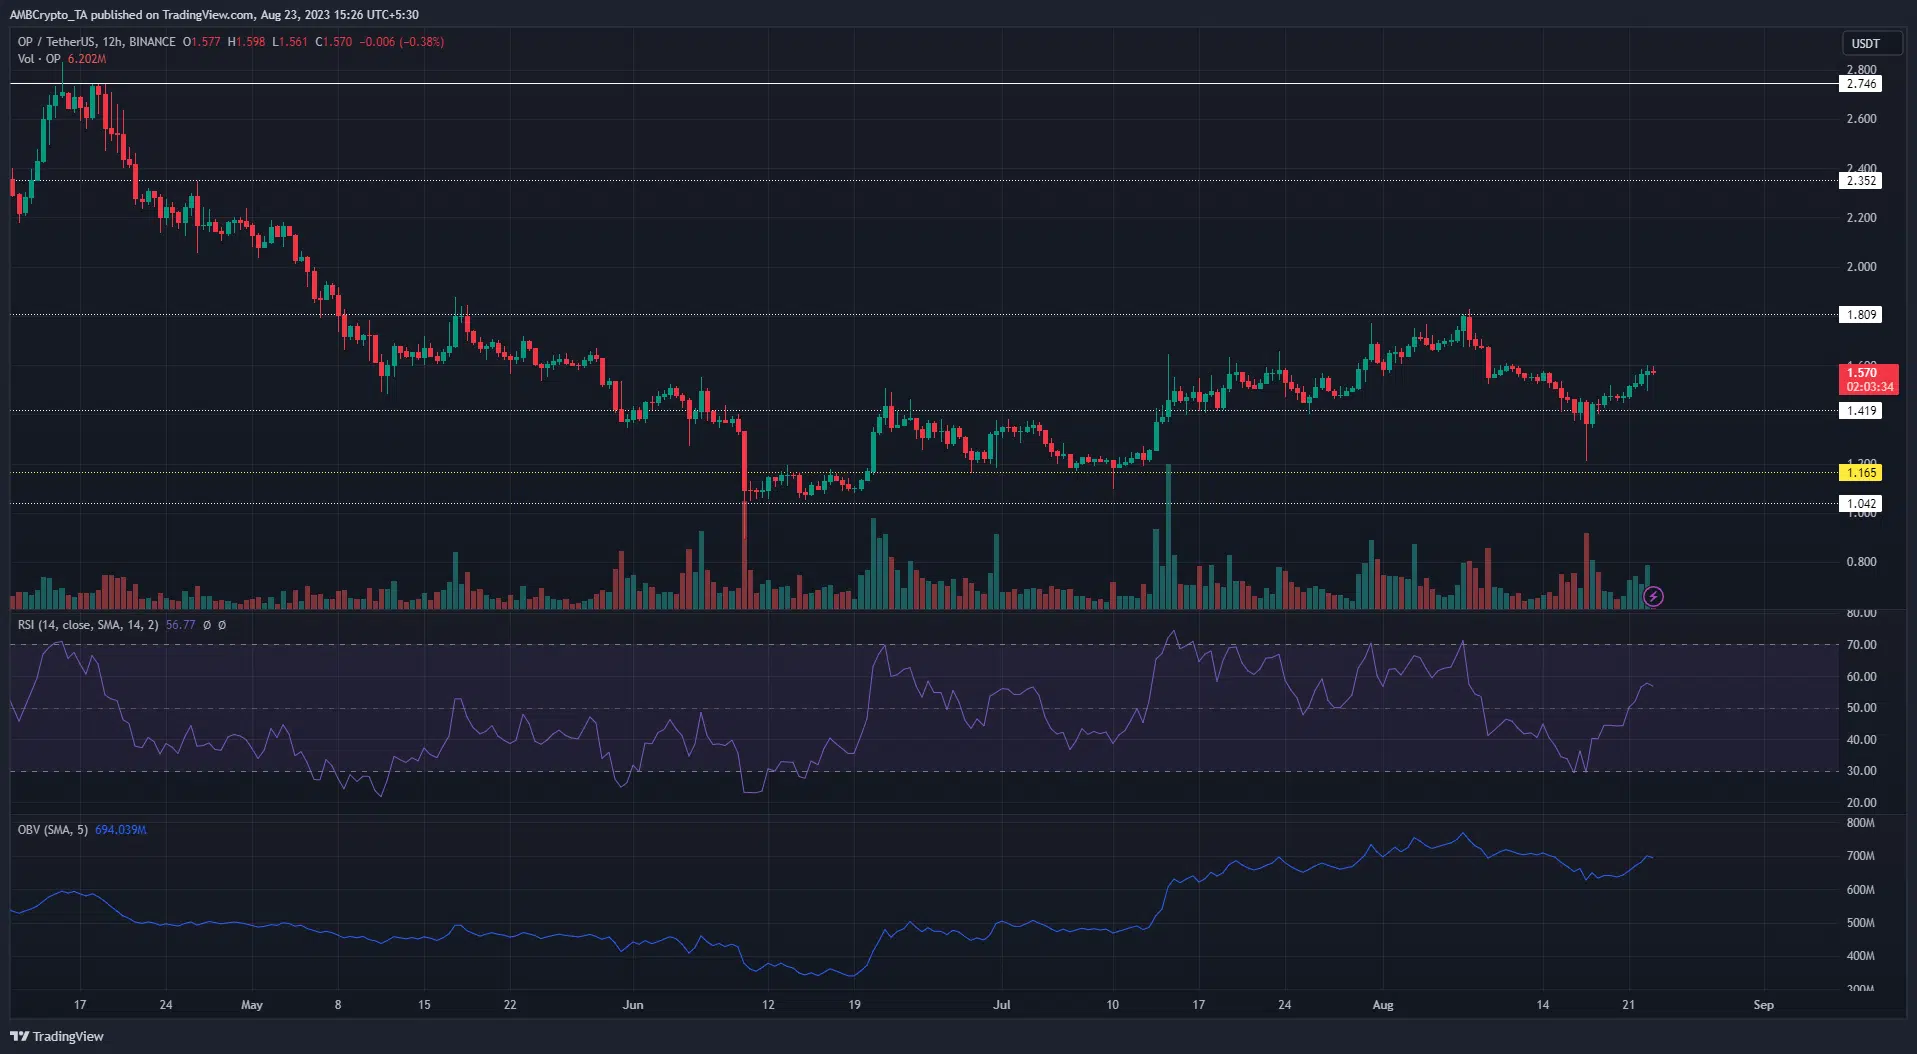
Optimism [OP] extended its ranging price movement, with prices rebounding from the range-low of $1.41. This kept Optimism firmly between the upper range of $1.80 and the lower range of $1.41, as bulls and bears continued to fight to gain the upper hand.
How much are 1,10,100 OPs worth today?
With the market still reeling in uncertainty amidst Bitcoin’s [BTC] large price swings, the native token of the Layer-2 scaling solution might see a continuation of its compact price range.
Neither buyers nor sellers willing to give up their positions
A look southward highlighted the tendency of OP to always fall into ranging price movements. Previously, price oscillated between $1.41 and $1.80 from 8 May to 7 June before bottoming out at the $1 price zone.
The bullish rebound from $1 saw the price stuck again between the $1.16 to $1.41 range from 20 June to 14 July. After bulls flipped the $1.41 level to support, another ranging price movement ensued between $1.41 and $1.8.
Currently, momentum seems to lie with bulls as they make another attempt at pushing past the $1.8 resistance. Based on historical data, bulls are likely to be successful on the second attempt, with take profit levels at $2.1 to $2.3.
On the flip side, another failure at the $1.8 resistance level will extend the range-bound movement, with bears looking to reclaim the $1.41 level.
In the meantime, the chart indicators alluded to the short-term bullish upper hand. The Relative Strength Index (RSI) stayed above neutral 50 with a reading of 55. This hinted at steady buying pressure. Also, the On Balance Volume (OBV) experienced a decent uptick to register the presence of active buyers.
Longs encouraged by price rebound
Is your portfolio green? Check out the OP Profit Calculator
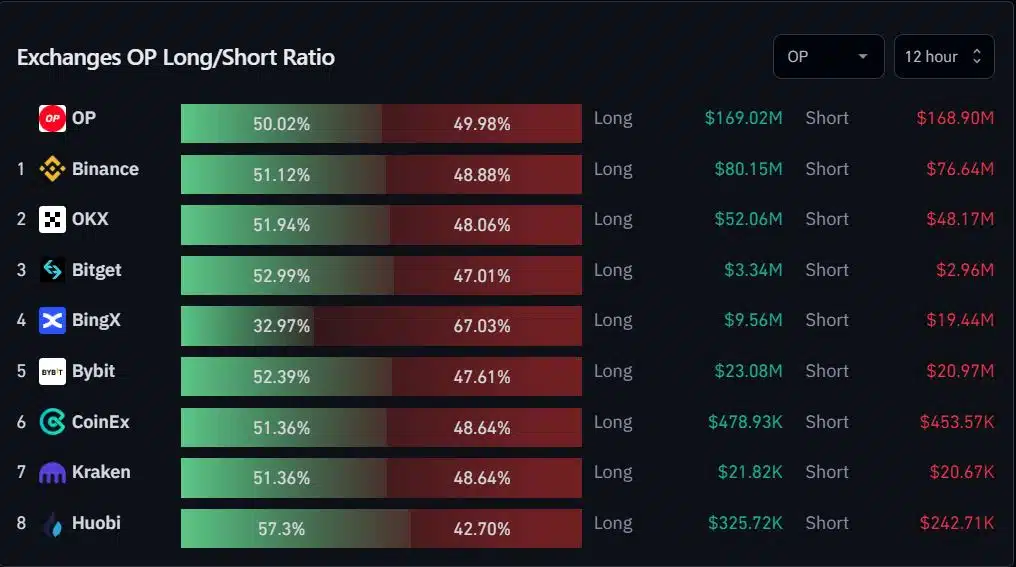
Data from Coinglass captured a rising bullish bias in the futures market. On the exchange long/short ratio, long positions held a slender advantage of 50.02% ($169.02M) to 49.98% ($168.90M) of short positions.
However, the $102k spread between both positions highlighted the tendency for prices to swing either way at short notice. This makes it critical for OP traders to consistently track BTC’s price action before opening new positions.


