PancakeSwap [CAKE]: All you need to know before going long

Disclaimer: The findings of the following analysis are the sole opinions of the writer and should not be considered investment advice.
The recent recovery from the two-month trendline support (white, dashed) evoked a bullish crossover on PancakeSwap’s [CAKE] daily 20/50 EMA.
The resultant growth has put the alt at the brink of its near-term EMAs. But the $4.4-$4.2 range could keep posing recovery hurdles in the coming sessions.
A potential rebound from the trendline support could aid the buyers in propelling near-term gains before facing bottlenecks in the immediate resistance range. At press time, CAKE traded at $3.912, up by 1.24% in the last 24 hours.
CAKE Daily Chart
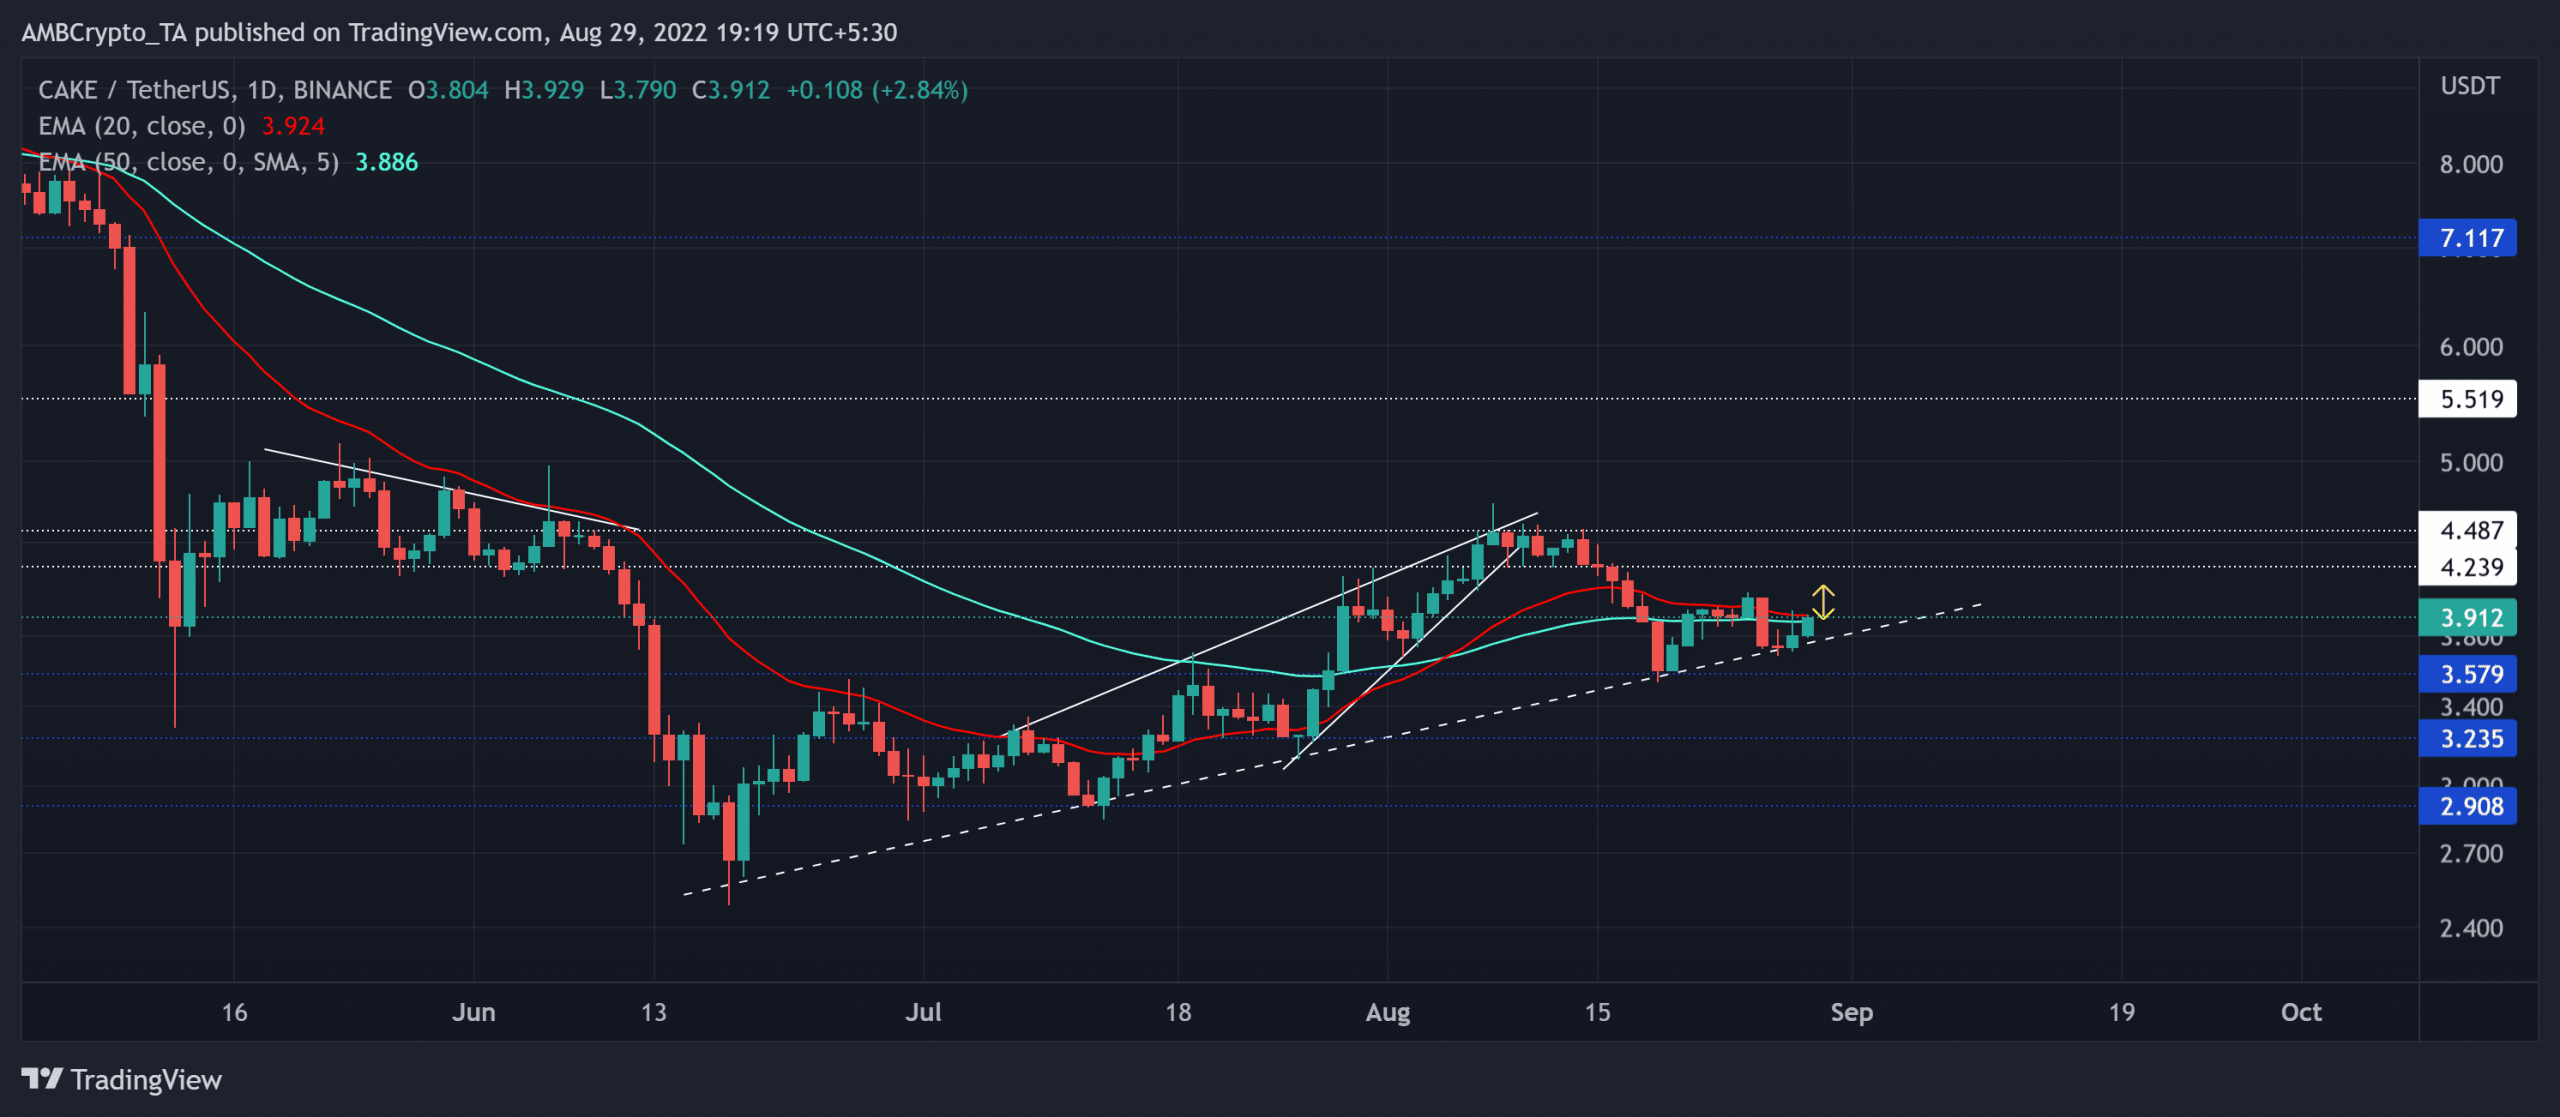
CAKE witnessed a rising wedge (white) recovery that set the stage for its bullish resurgence. But the $4.2-$4.4 range flipped to resistance by reigniting the near-term selling pressure.
Despite a patterned breakdown, the 20 EMA (red) managed to sway above the 50 EMA (cyan) while the coin found its grounds near the trendline resistance.
These movements have inflicted a slow-moving phase near the EMAs. A convincing bounceback from the trendline support could put the bulls in the driving seat to evoke a volatile break.
The current rebound from the trendline support could find a reversal from the $4.2-$4.4 range. A rebound from this range would position the coin for a retest of the trendline support.
In either case, a decline below the trendline support would confirm a bullish invalidation and would hint at a sell signal.
Rationale

The Relative Strength Index (RSI) crawled itself just above the midline mark to depict ease in the selling pressure. A continued position above the 50-level could reaffirm the bullish edge.
Also, the Chaikin Money Flow (CMF) exhibited slight ease in selling vigor. But the traders should look for a potential close above the equilibrium to confirm the bullish bias.
The Directional Movement Index (DMI) lines revealed a rather neutral stance. But the ADX depicted a substantially weak directional trend for CAKE.
Conclusion
The current rebound from the trendline support could find hurdles in the $4-zone. With the indicators flashing mixed signs, buyers should keep an eye out for a sustained close above the 20/50 EMA to corroborate the bullishness.
The potential targets would remain the same as discussed. Finally, keeping a watch on the king coin’s movement could help make a profitable bet.


![Rising bond yields put Bitcoin [BTC] at risk — a Fed rate hike could be next](https://ambcrypto.com/wp-content/uploads/2026/08/IMG_4752-e1785656382502.webp)