PancakeSwap, WAVES, IOTA Price Analysis: 20 April

Continuing its Ascending channel rally, CAKE displayed a buying advantage while looking at the 4-hour 20 EMA for immediate support. Similarly, WAVES and IOTA correlated with the broader revival in the last two days and saw a lift-off from their long-term floors. But the overall directional trend for these alts still stood quite weak.
PancakeSwap (CAKE)
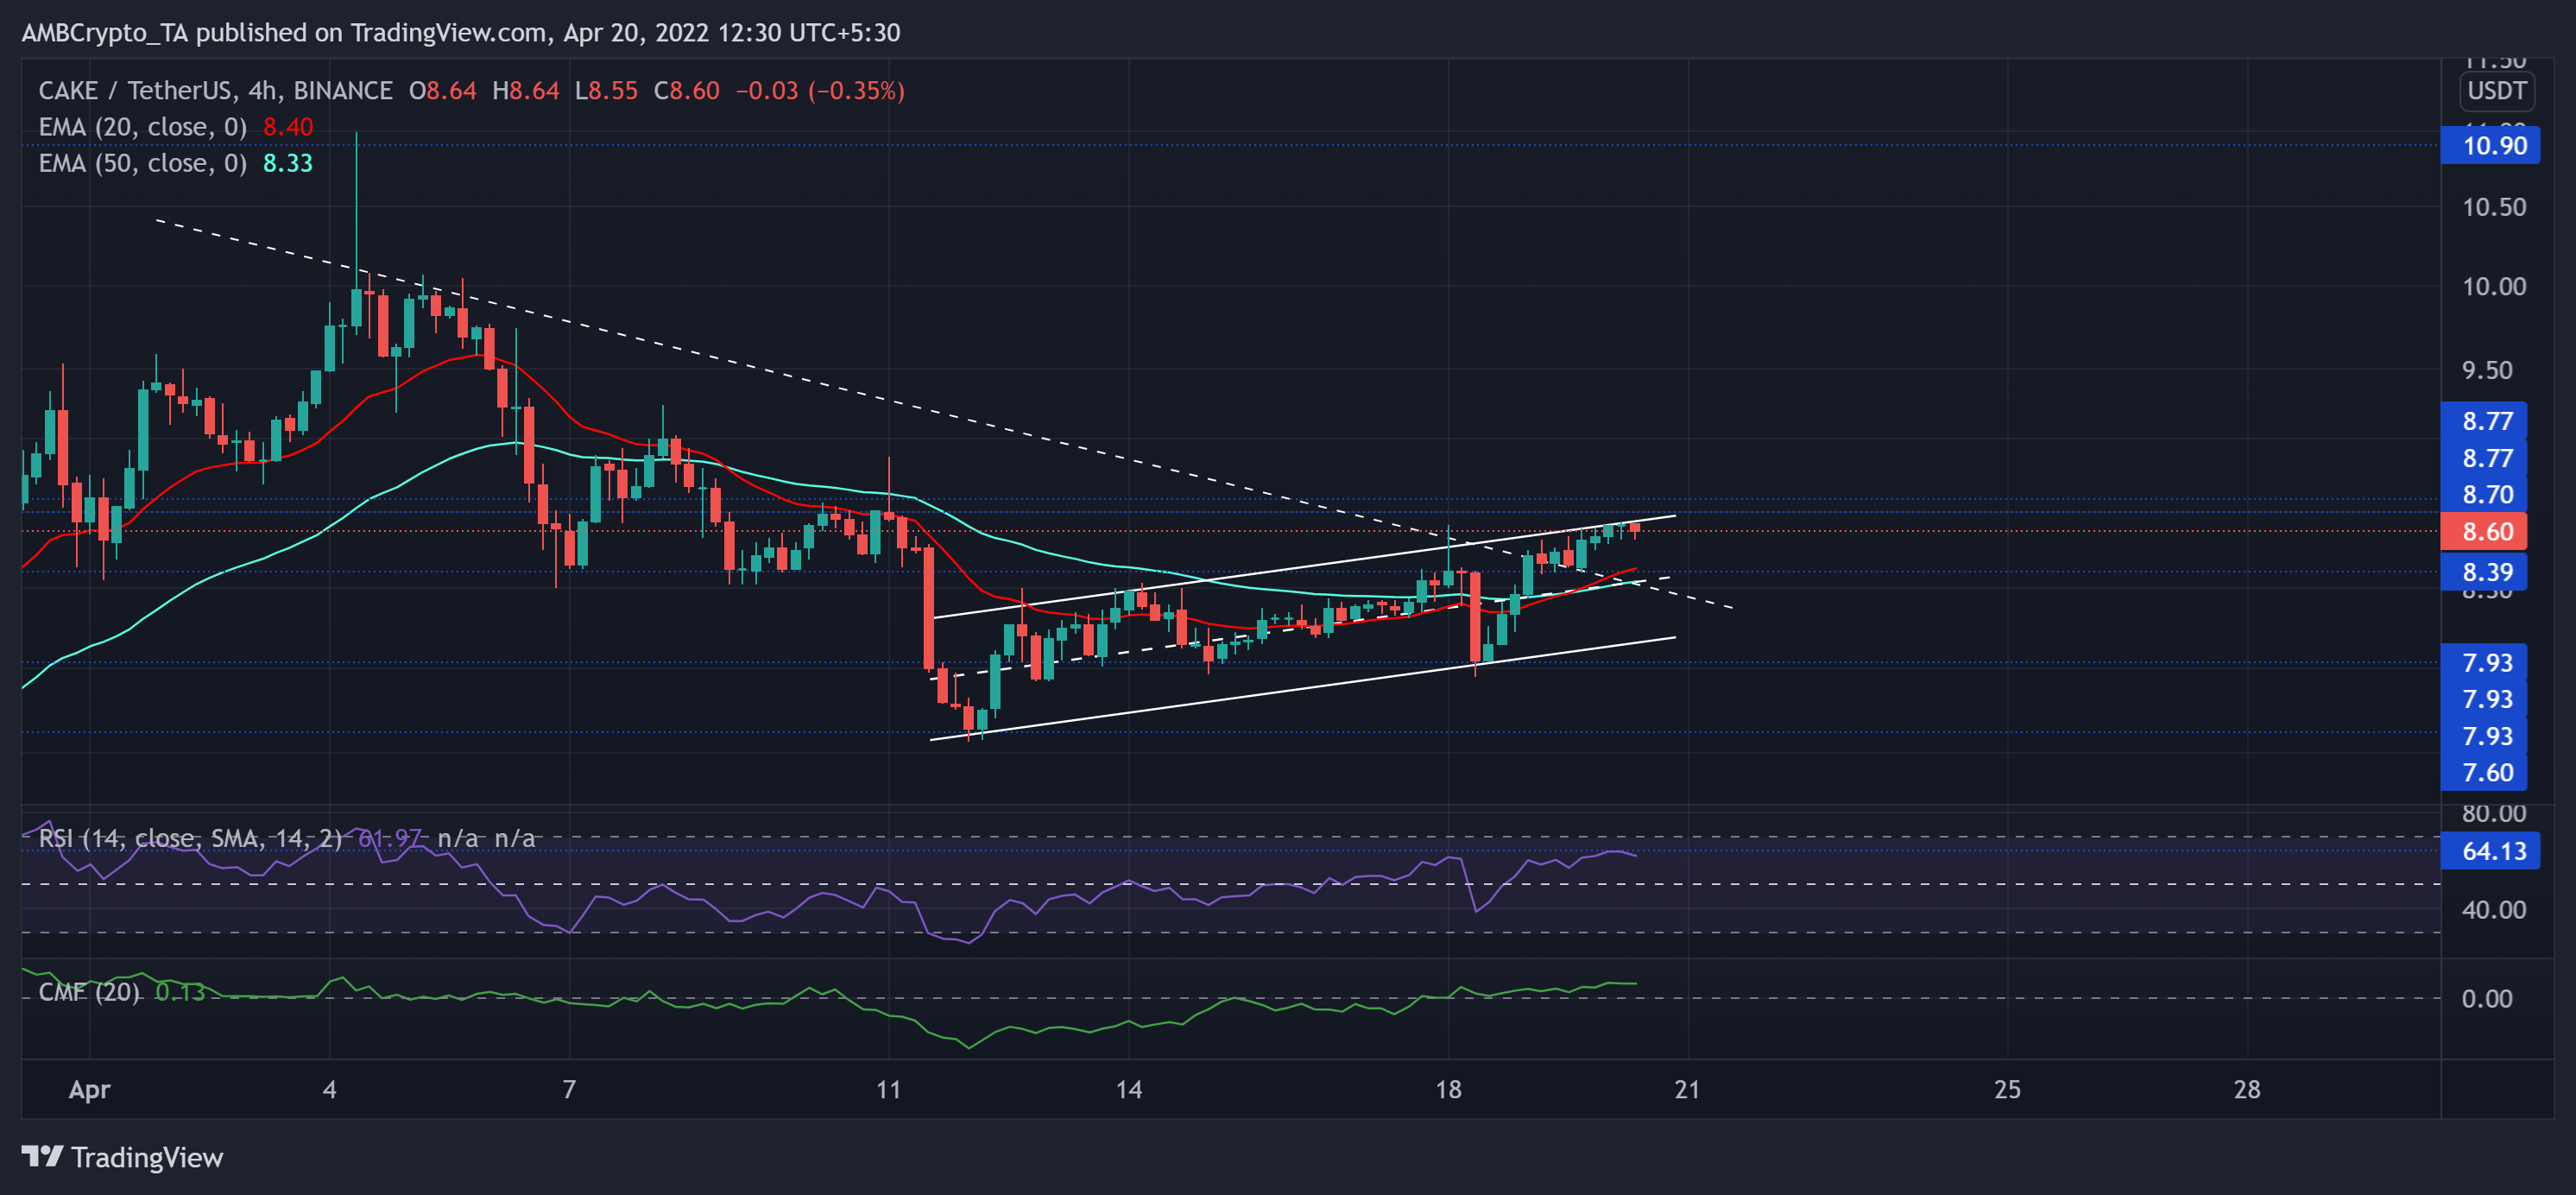
Since dropping below $16 in November of last year, The bulls took a back seat in the vigorous plunge phase while CAKE lost more than half its value. After poking its multi-month low on 16 March, the bulls have finally steered the trend in their favor.
The buyers negated the most recent bearish retracement by triggering an up-channel (white) rally that helped CAKE flip the trendline resistance to support (white, dashed). With the 20 EMA (red) crossing over the 50 EMA (cyan), the $8.3-mark should offer strong support.
At press time, the digital currency traded below 80.5% of its ATH at $8.6. The RSI seemingly slowed down at the 64-mark whilst displaying a heightened edge for the bulls. Furthermore, the CMF reaffirmed the RSI’s bullish stance by swaying above the zero-mark.
WAVES

WAVES steeply fell since the beginning of this month as it pierced through multiple resistance points. The altcoin lost nearly 67.02% of its value from 31 march to date.
Over the past few days, the $18.6 floor triggered a buying revival that helped propel a rally toward its Point of Control (red). But the Supertrend still struggled to alter its position from the red zone. The immediate resistance stood near the 50 EMA (cyan).
At press time, WAVES was trading at $21.3. The RSI jumped from the oversold region to the 54-mark over the last two days. Any retracements from here would find testing support at the equilibrium. Although the +DI looked north, the ADX revealed a weak directional trend for the alt.
IOTA (MIOTA)
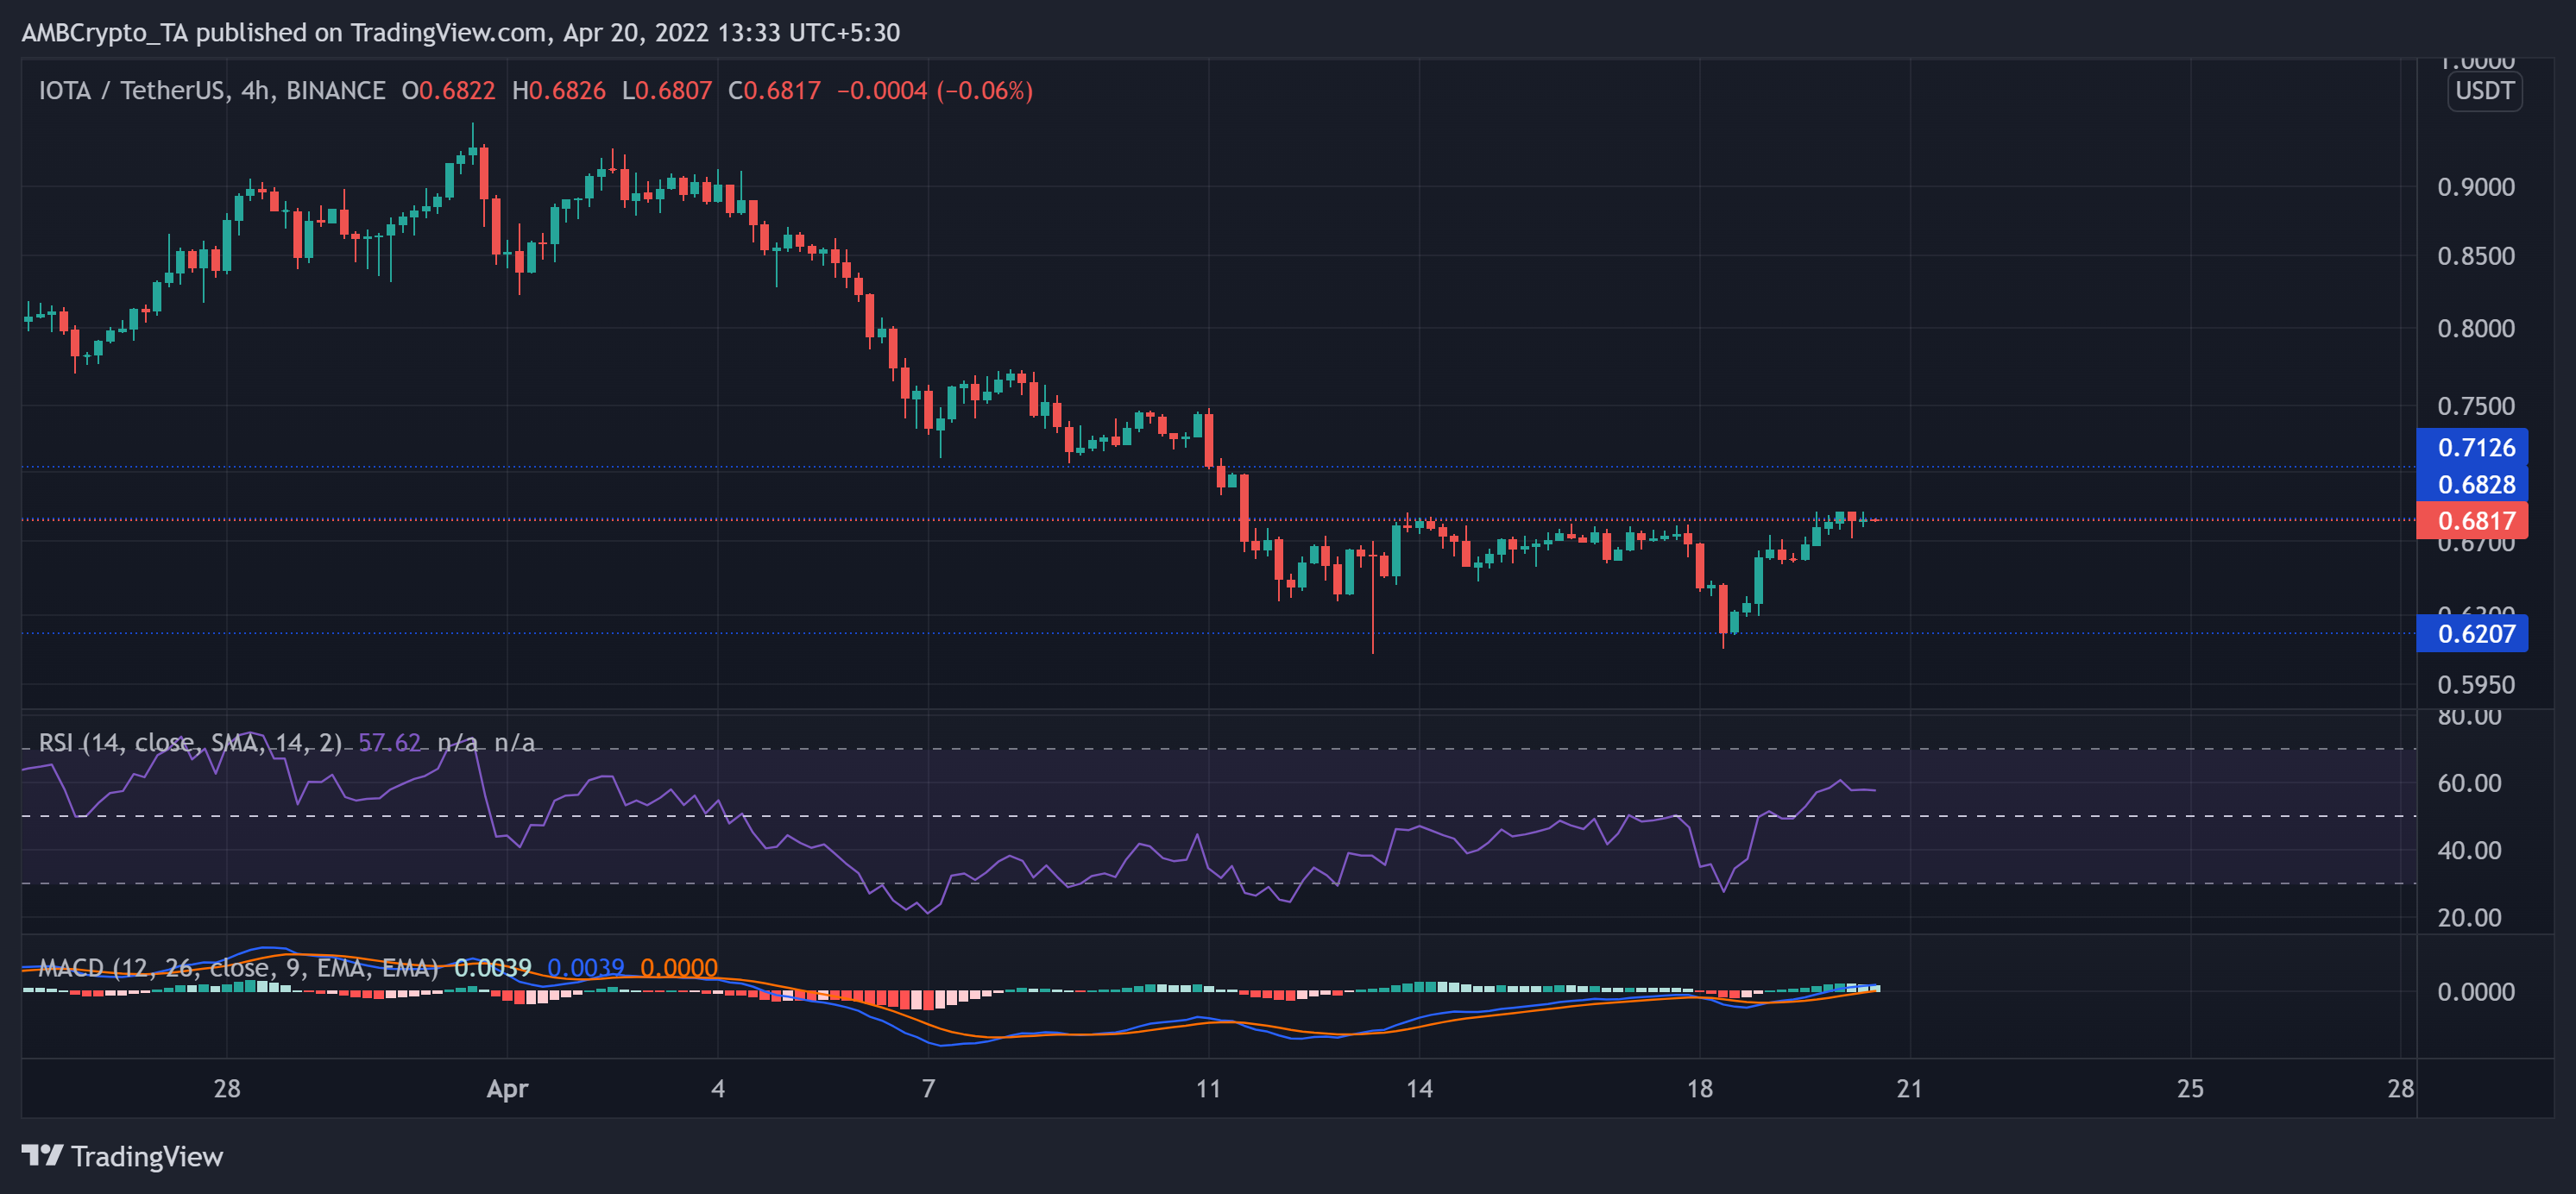
IOTA saw a substantial up-channel breakdown on 2 April and marked a 33.85% retracement towards its eight-month low on 13 April. Consequently, the bears flipped the vital $0.7-mark from support to immediate resistance.
But the bulls found their ground at the $0.6-mark and caused a rally that fetched nearly 11.5% gains in the last 12 days.
At press time, IOTA traded at $0.6817. The near-term technical indications hinted at an increased buying influence. The RSI chose the bulls by moving well above the 50-mark. Also, the MACD and signal line oscillated above the zero-mark while reaffirming the bullish viewpoint.